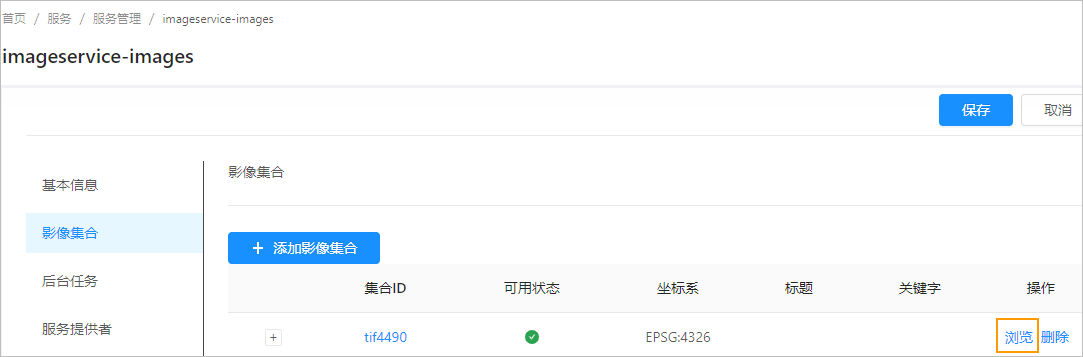
After the Image Data is quickly published through "Add Image Collection", in the Image Collection list, as shown in the following figure, click "Browse" to preview the image, that is, browse the image through the REST Service interface.
In this example, Browse the Image Collection from: http://localhost:8090/iserver/representations/imageServiceOpenlayers3/map.html?serviceName=imageservice-images&mapName=tif4490
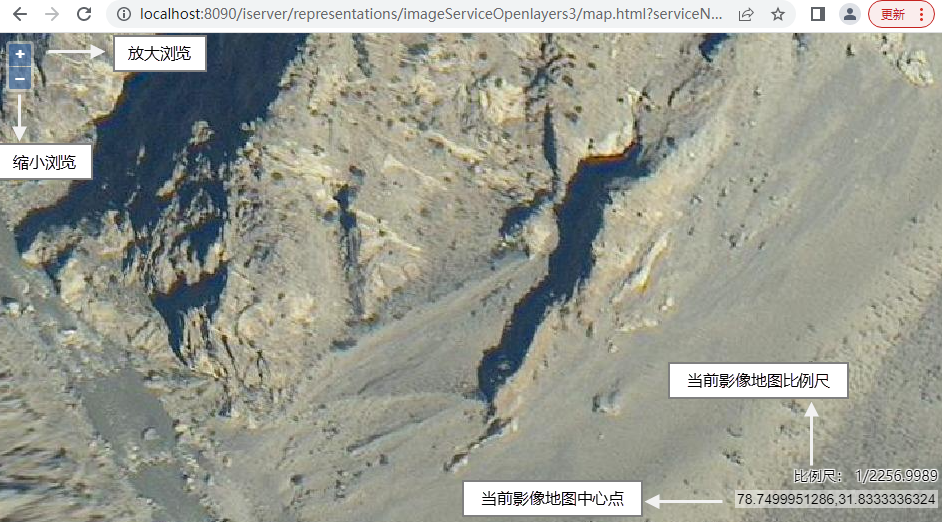
In the browsing page, you can use the zoom-in and zoom-out buttons to zoom the Image Map, or you can use the mouse wheel to zoom the Image Map, and the current Image Map Scale is displayed synchronously in the lower right corner. Hold down the left mouse button and drag the map to pan and browse the Image Map, the center point of the current Image Map is displayed synchronously in the lower right corner. You can also edit the Center Coordinates to pan map. Click the left mouse button on the Center Coordinates to activate the editing state of the center point. The format of Center Coordinates is: "Longitude" + "Comma" + "Latitude", for example: 78.75037600228012, 31.83329071705576.
The image browsing performance of the image service has always been the focus of attention of users. In order to display the image plotting performance more intuitively, the image preview provides a debugging mode, which can display the time information of drawing and obtaining Image Data. These two indicators can basically reflect the image browsing performance in the current environment.
How to open the debug mode: add the debug = true parameter after browsing the access address of Image Collection. The example is as follows:
http://localhost:8090/iserver/representations/imageServiceOpenlayers3/map.html?.ol?debug=true&serviceName=imageservice -images&mapName=tif4490
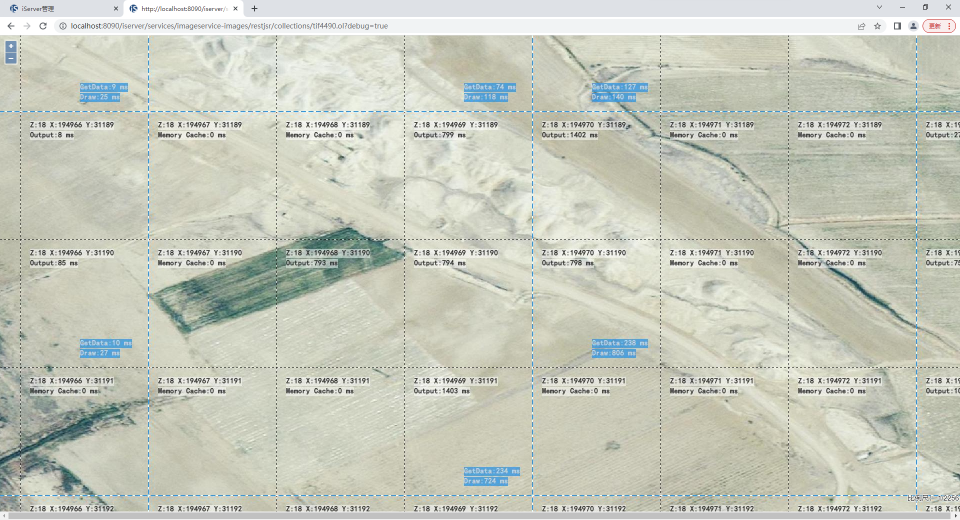
As shown in the figure above, in the debug mode, each Tile and Tile grouping will be marked through the grid line, and the related time-consuming Statistic Infomation will be marked at the same time. The following is a detailed description of all the information presented in this mode.
As shown in the above figure, the blue dotted line frame marks the Tile grouping. When the server dynamically plots, 9 tiles are plotted once as a group (9 tiles in the square blue dotted line frame are plotted as a group). The plotting performance depends on the efficiency of reading Image Data and drawing data. In the debug mode, reading data (GetData) and drawing data (Draw) are marked on a Tile in the group with blue background text.
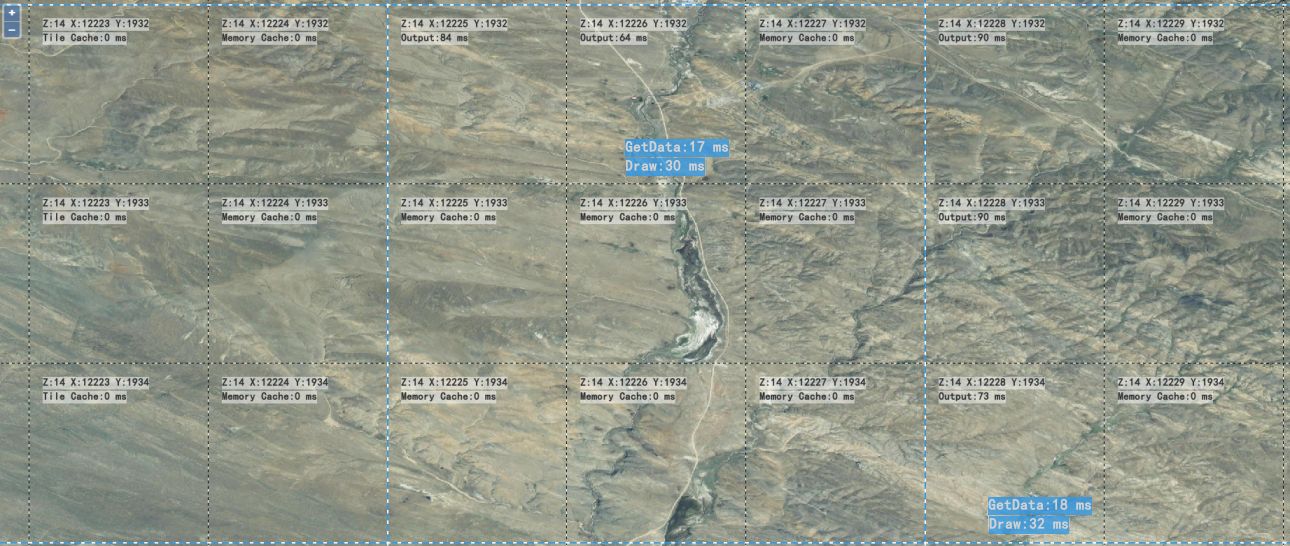
In practical applications, massive images are usually not stored locally in the server, but are stored in NAS network or object storage. The efficiency of accessing images in these storage media is greatly affected by the network environment configuration. Through this parameter, the problem of poor image browsing performance caused by such factors can be located.
As shown above, a black and white dotted box marks each Tile.
When browsing the Image Collection, the front-end load displays three sources of Tile:
Tiles from three sources may appear at the same time, and the load order is: existing Tile under the cache directory > server memory cache Tile > server-side dynamic plotting Tile.
The Tile is marked with its level and row number, as well as its source and response time in milliseconds (ms).