Plan reporting 3D scene dashboard application case |
MapDashboard WebApp can add 3D scene resources, build a plan reporting dashboard based on scene, which supports multi-angle scene snapshots, freely angles switching by one-click, and linkage between 2D geographic information and 3D scene.
This section provides a practical application case of the plan reporting dashboard based on 3D scene: Petroleum Pipeline Platform. The dashboard application can visually manage the pipeline base and monitor the state of pipe network on the basis of the pipeline network scene.
It covers the overview of the base, pipeline state monitoring, personnel and facilities management statistics of the base. And it can be applied to the project reporting and display of the pipeline network industry, helping industry personnel to quickly and intuitively know the operation and maintenance status of the pipeline network.
Now we take this case as an example to introduce how to build a plan reporting dashboard based on scenes. The details of this case can be seen in the template 'Petroleum Pipeline Platform' in MapDashboard WebApp. The build process mainly includes:
After logging in iPortal, you can access the MapDashboard WebApp in the following ways to create empty dashboard.
Add the profile data of petroleum pipeline as the data source of the dashboard components. Click 'Data' in the left sidebar of the dashboard, then click 'Add data' and fill in the 'URL' column under the 'Service' tab page with the service address of the profile data of petroleum pipeline. The data 'petroleum.json' is from the built-in dashboard template 'Petroleum Pipeline Platform' , and the data URL is http://<server>:<port>/iportal/apps/mapdashboard/v2/static/templates/petroleum-pip
eline/data/petroleum.json.
The Petroleum Pipeline Platform dashboard application covers the following modules: the base overview, the state monitoring of the pipeline network, and the statistics of the personnel and facilities. So it is necessary to create a master page and three pages. Click 'Page' > 'Add masterPage' > 'Empty Page' in the left sidebar to create a empty master page; then click 'New Page' > 'Blank Page' in the left page panel and create three empty pages, and each page is used to display the following content.
Step 1: Add the petroleum pipeline network scene
(1)Click the master page in the left page list to open it, then click 'Components' > 'Maps' in the left sidebar and drag a scene component to the master page. Click the layout icon ![]() in the operation menu next to the scene component, set the component layout to 'Full Screen'.
in the operation menu next to the scene component, set the component layout to 'Full Screen'.
(2)Select the scene component, and configure the scene source in the right property panel. The scene of the current dashboard is derived from the example scene data 'petroleum station' in the iEarth WebApp.
(3)You can drag the scene, hold down the mouse wheel, or change the coordinate and orientation attributes to adjust the scene to a appropriate angle. The scene is shown as follows.
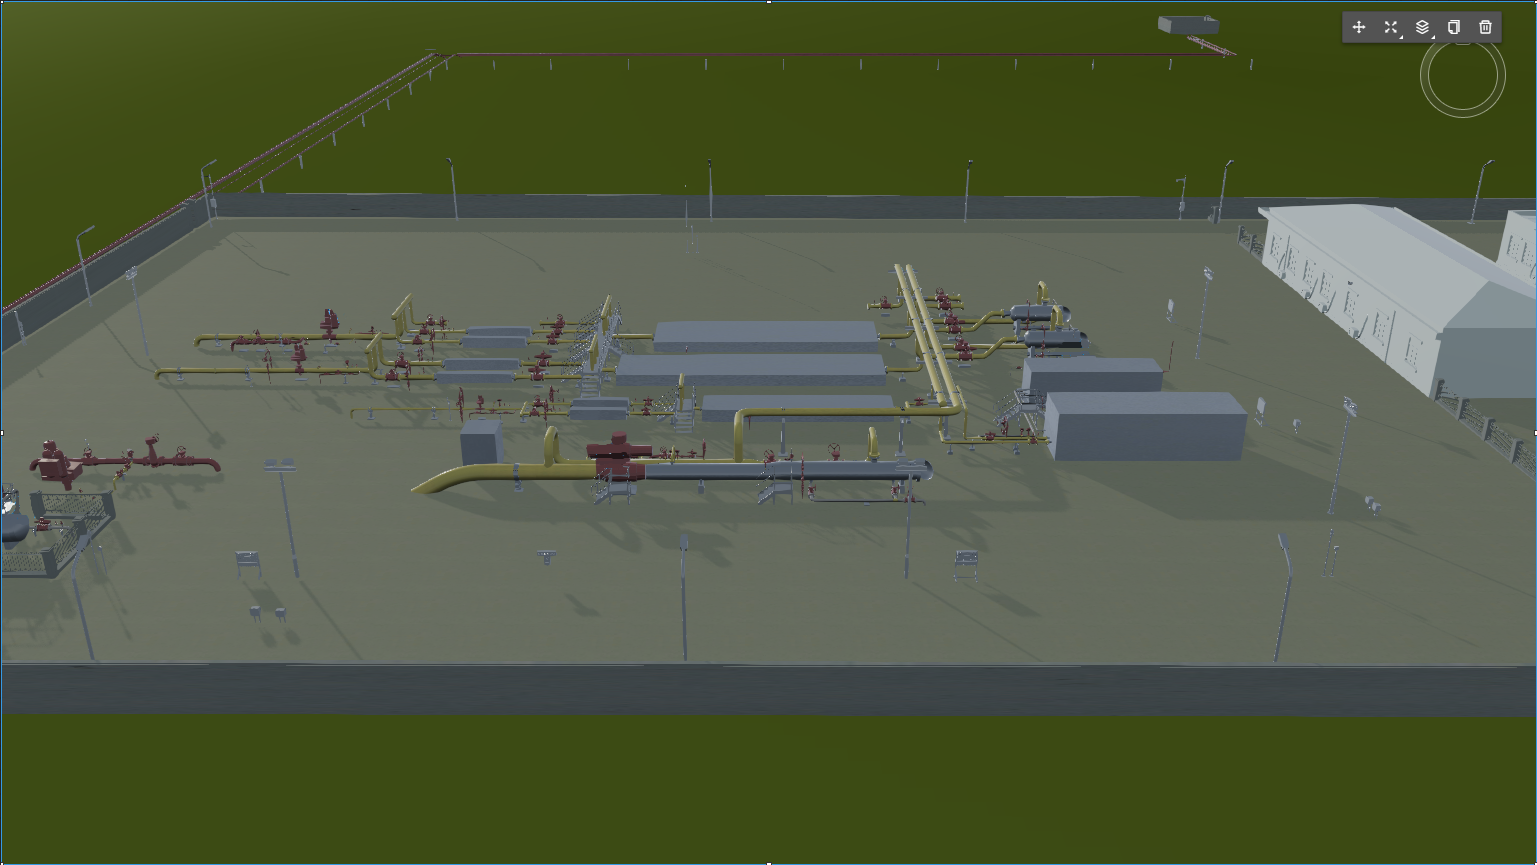
Scene component
Step 2: Add background and title
(1)Create style of page background by using container components. Click 'Components' > 'Layout' in the left sidebar and drag several container components to the master page. Click the layout icon ![]() in the operation menu next to the container component to spread the container component by width or height.
in the operation menu next to the container component to spread the container component by width or height.
(2)In the property panel of each container component, set the background image and image repeat mode of the container. You can use images in MapDashboard material library or upload a custom image, and set image repeat mode as 'stretch'.
(3)Create the title of dashboard by using a text component. Click 'Components' > 'Common' in the left sidebar, and drag a text component to the master page. Place the text component at the top center of the page, and set the text content as 'XX石油管网监控管理平台'. The master page style is shown as follows.
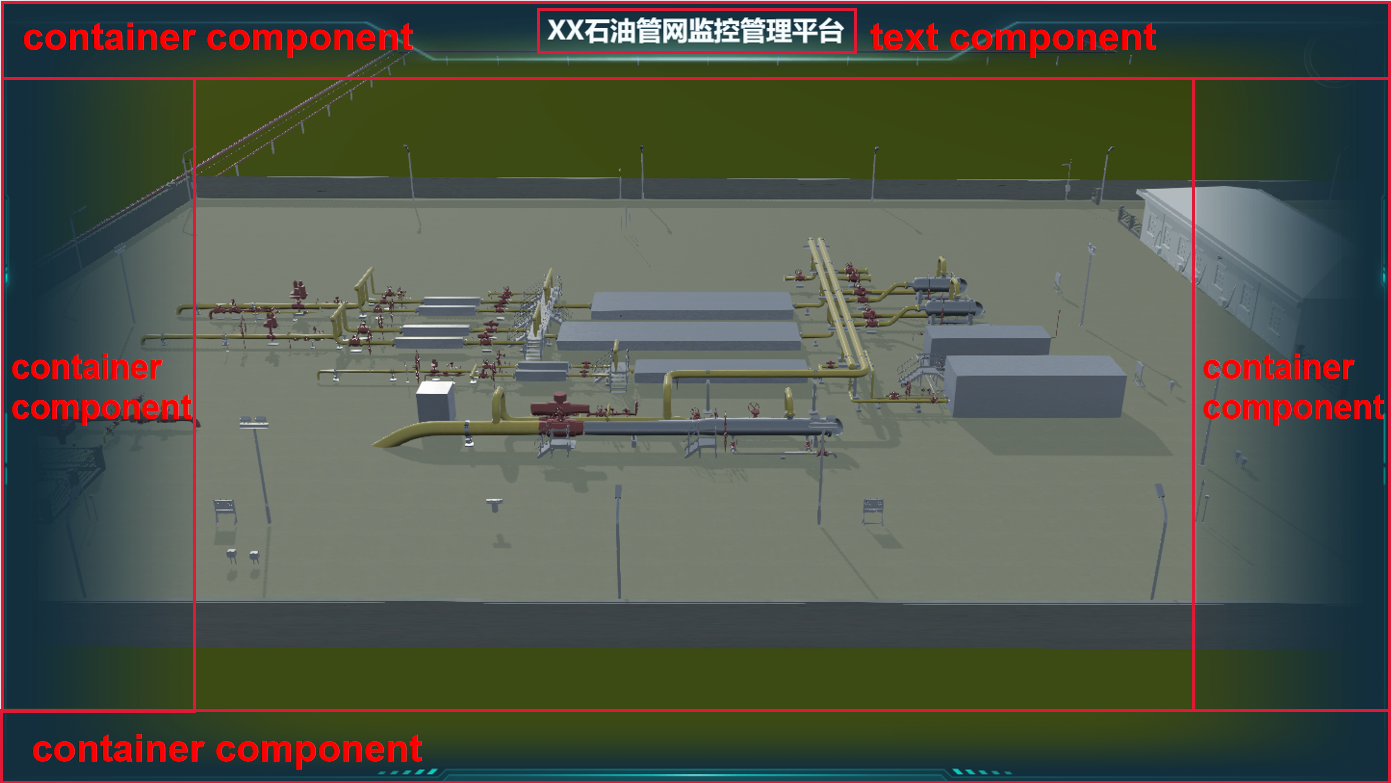
Master page style
Step 3: Add page navigation and set page toggle capability
(1)On the master page's left, you can create page navigation based on text components and image components. Firstly, Add the following components to form page navigation: three text components named 'Base Overview', 'Pipeline Monitoring', 'Base Management' and corresponding image components.
(2)Then add interactions for text components and image components to implement page switching, that is, click the text or image and it can jump to the corresponding page. The specific operation: click and select the text or image component, add trigger 'Click' under the interaction tab page of the right panel. Then click 'Add operation', select the corresponding page as the target and select 'Show' as the target operation, and then click 'OK' to complete the operation.
(3)Set the text style for text components and the image style for image components. Because clicking on the text component will jump to the destination page, you can further set the highlight style when the text component is selected. The component positions and styles are are as follows.
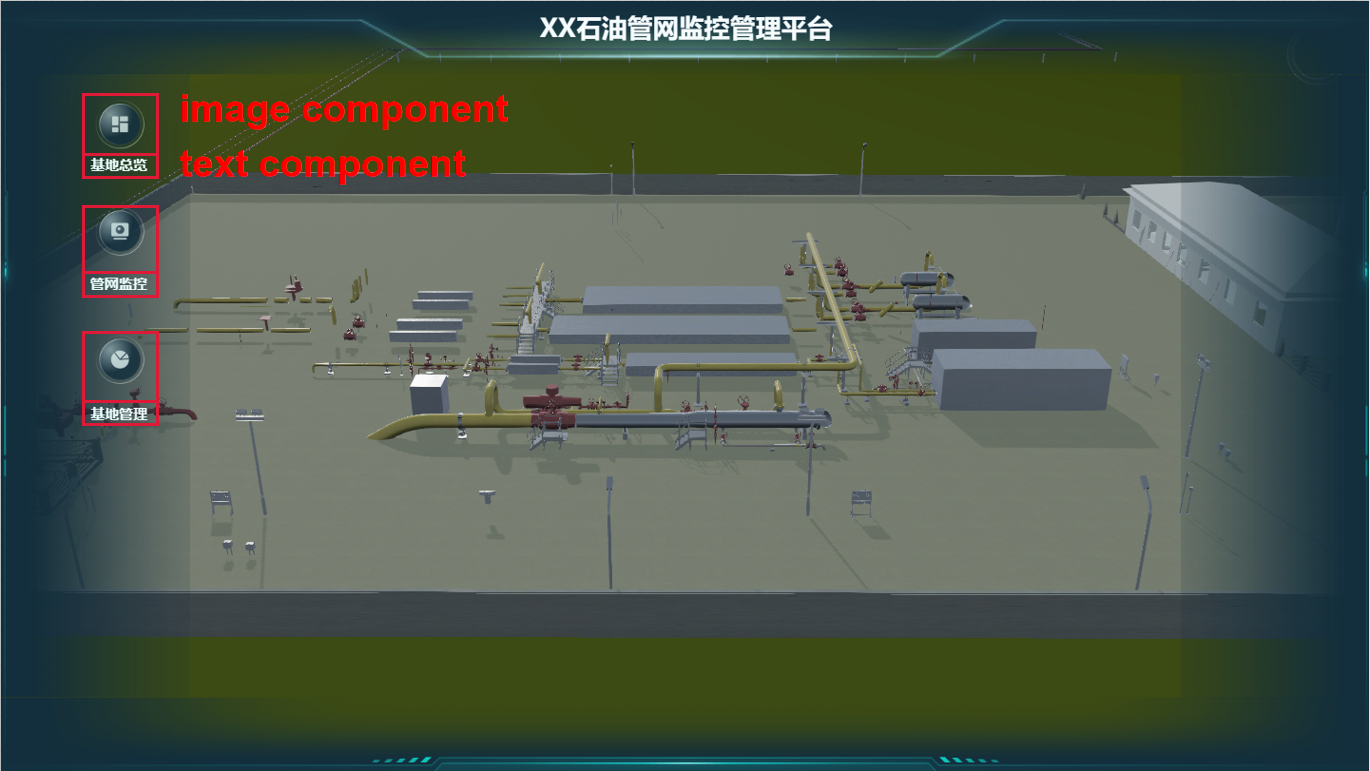
Page navigation style
Step 4: Apply master page to regular pages
Click 'Pages' in the left sidebar, and then click the ![]() icon on the master page in page list to apply the master page to all pages. The pages will display the content of the master page simultaneously.
icon on the master page in page list to apply the master page to all pages. The pages will display the content of the master page simultaneously.
Step 1: Edit Base Overview page
(1)On the Base Overview page, click and select the scene component and adjust the coordinate and orientation properties of the scene in the right side property panel. If you turn on the 'Follow Master' toggle , the scene angle of the current page will be consistent with the master page's.
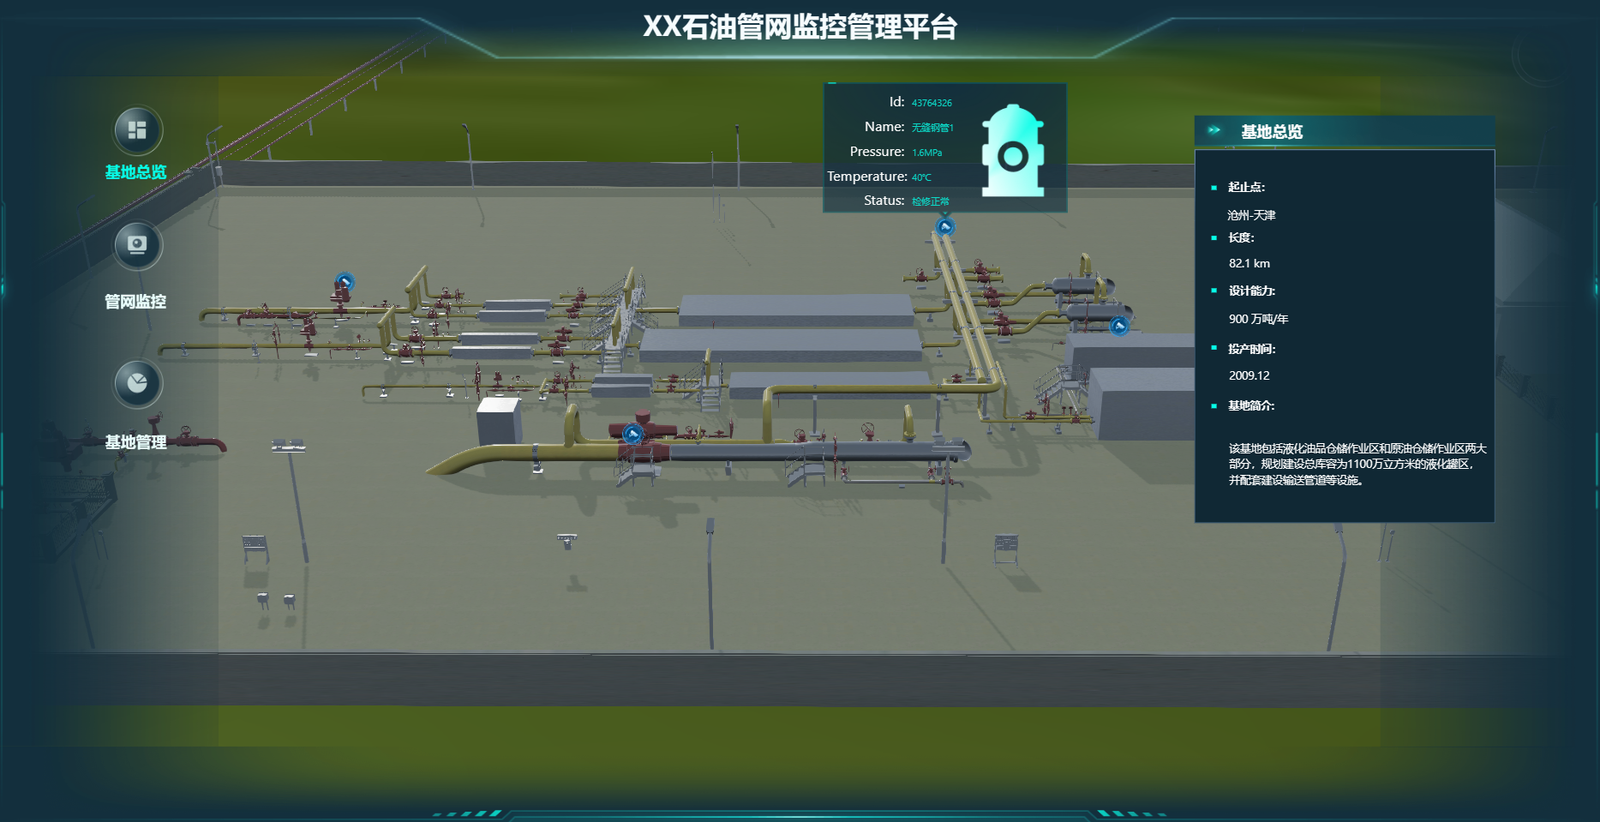
(2)Drag a series of container, icon and text components to the page, and set the background image of the container and icon components, and text content of the text components. The Base Overview page is shown as follows.
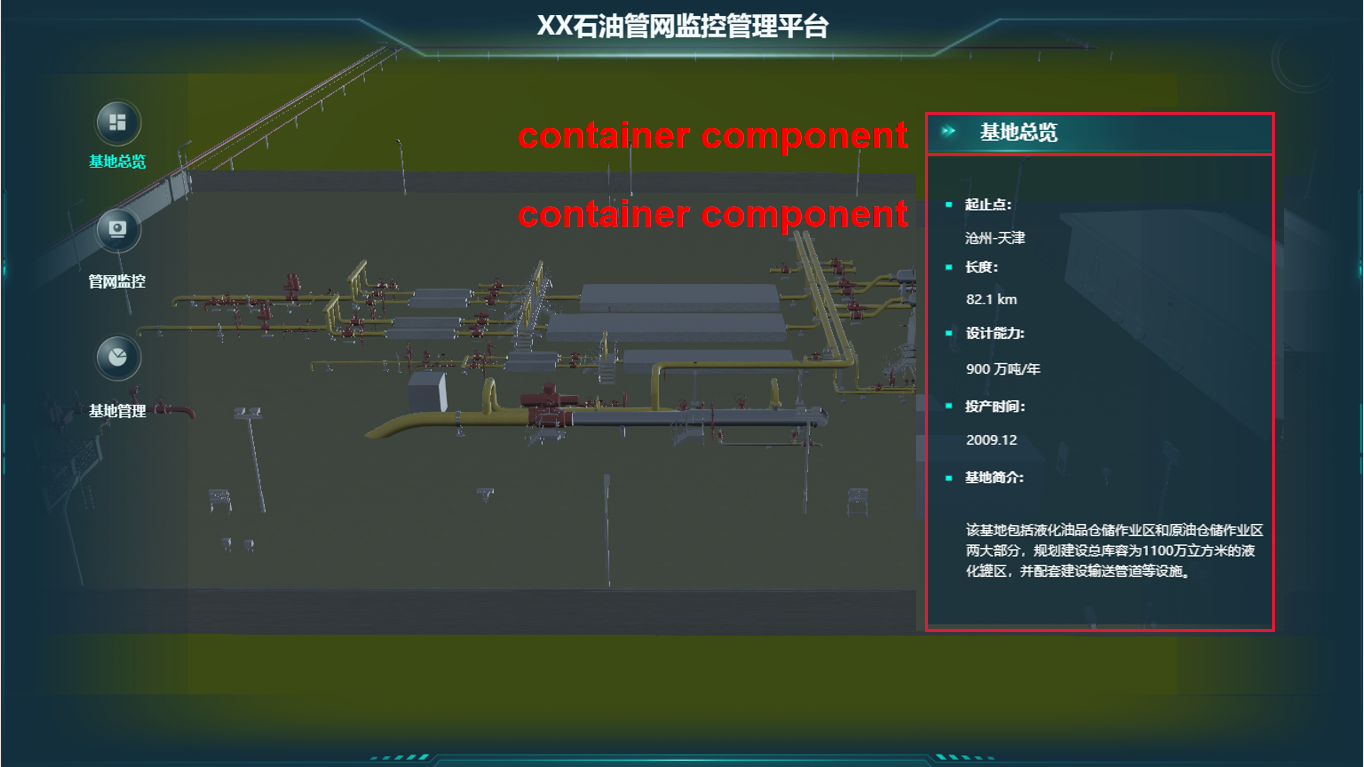
Base Overview page
Step 2: Edit Pipeline Monitoring page
To display information about the status of the pipeline network and facilities, follow the previous step to create a pipeline inspection display panel on the Pipeline Monitoring page. The difference is that we need to add a text list component to show the inspection status and a date&time component to show the inspection time.
In the left sidebar, select 'Components' > 'Common' and drag a text list component and a date&time component to the page. Set data source of text list component to petroleum.json, and select '类型', '检查情况' and '检查时间' as the data columns. You can set prefix, suffix, column width and other styles of text list component. The completed Pipe Network Monitoring page is shown as follows.
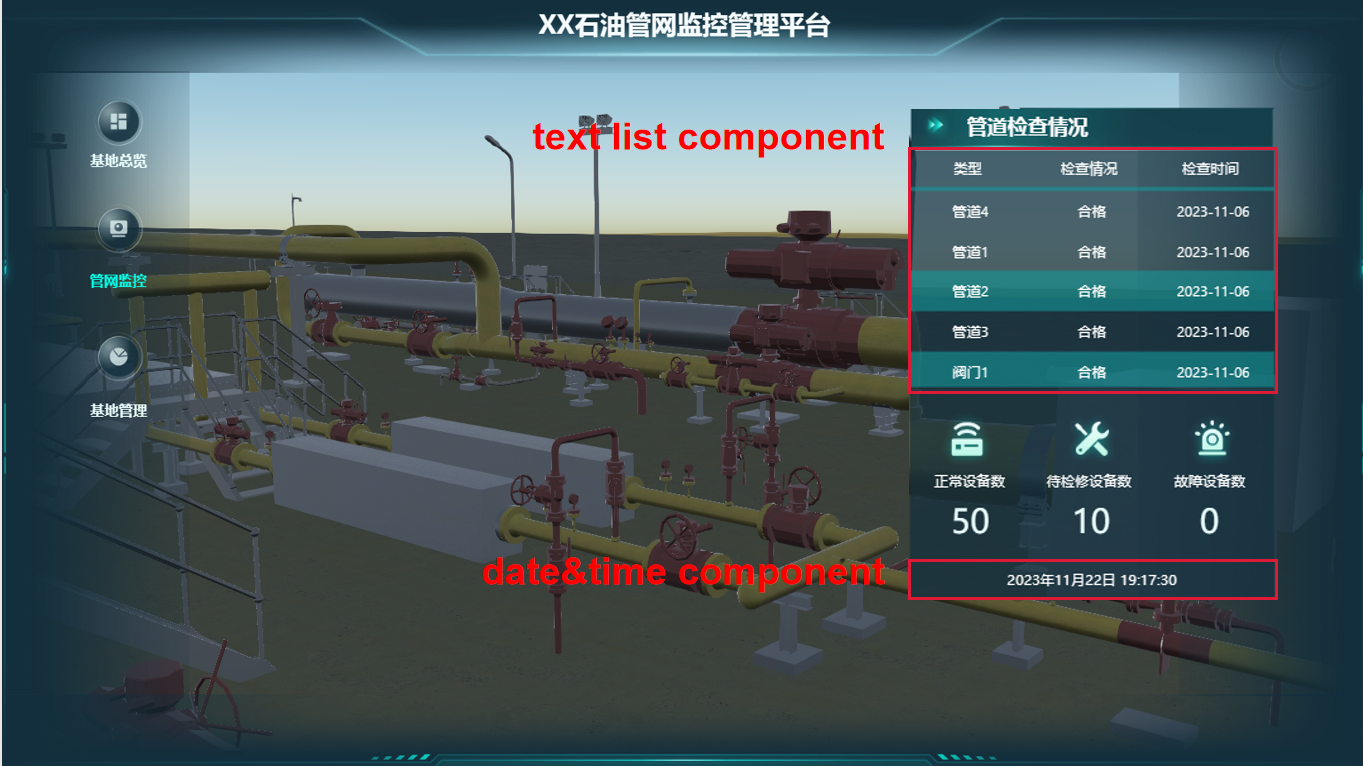
Network Monitoring page
Step 3: Edit Base management page
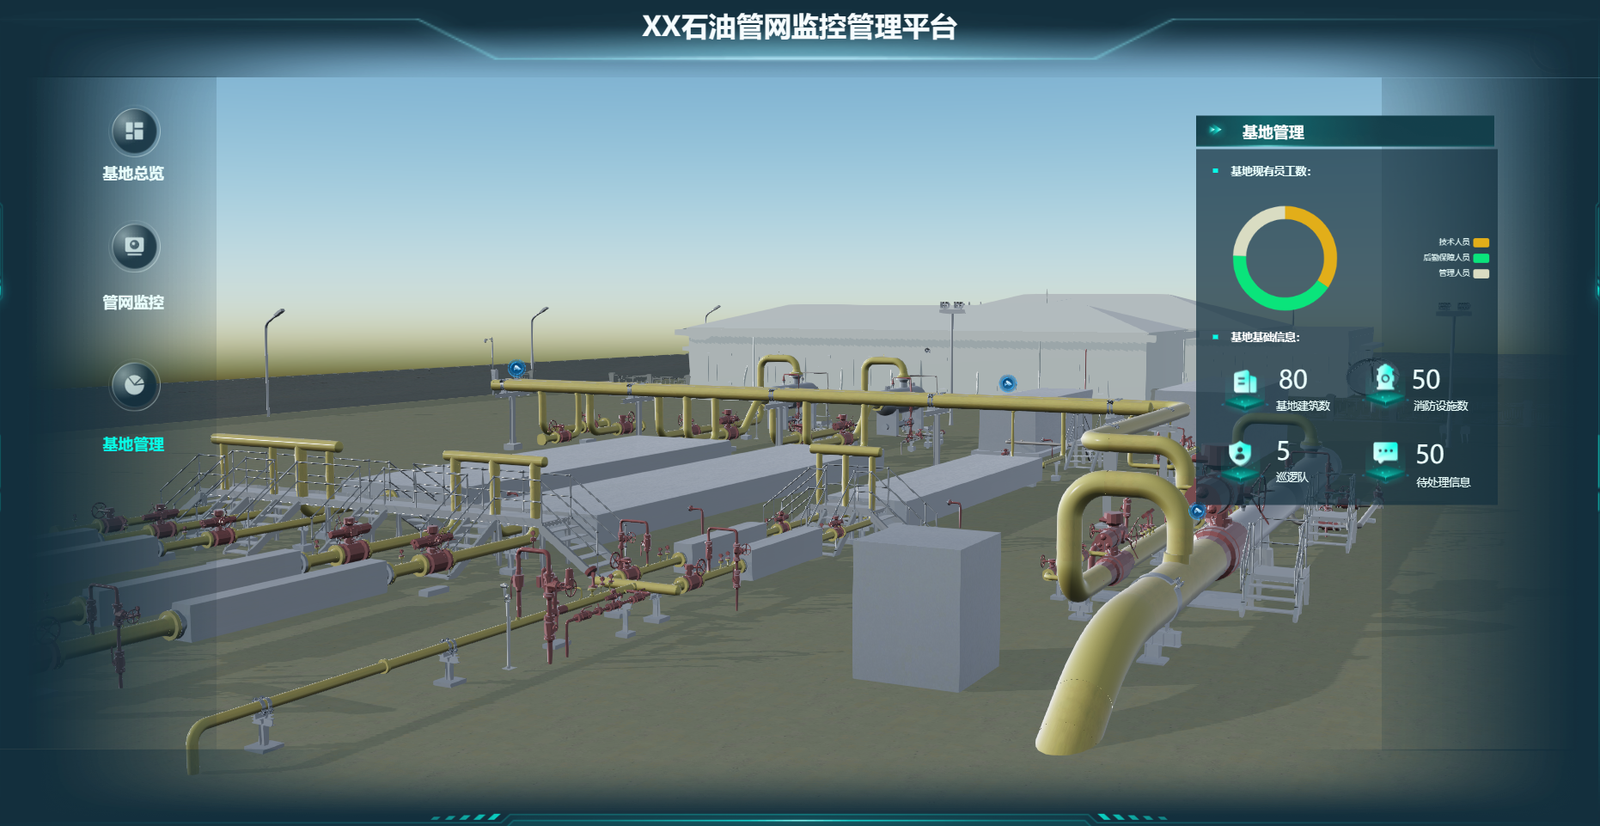
To display statistics about base management employees and facilities, follow the previous two steps to create a base management display panel on the Base Management page. The difference is that we need to add a doughnut component to show the type and number of employees.
In the left sidebar, select 'Components' > 'Charts' and drag a doughnut component to the page. Set the data source to petroleum.json, and select '人员信息' as category field and 'num' as value field. You can set color, background, size and other styles of doughnut component. The completed Base Management page is shown as follows.
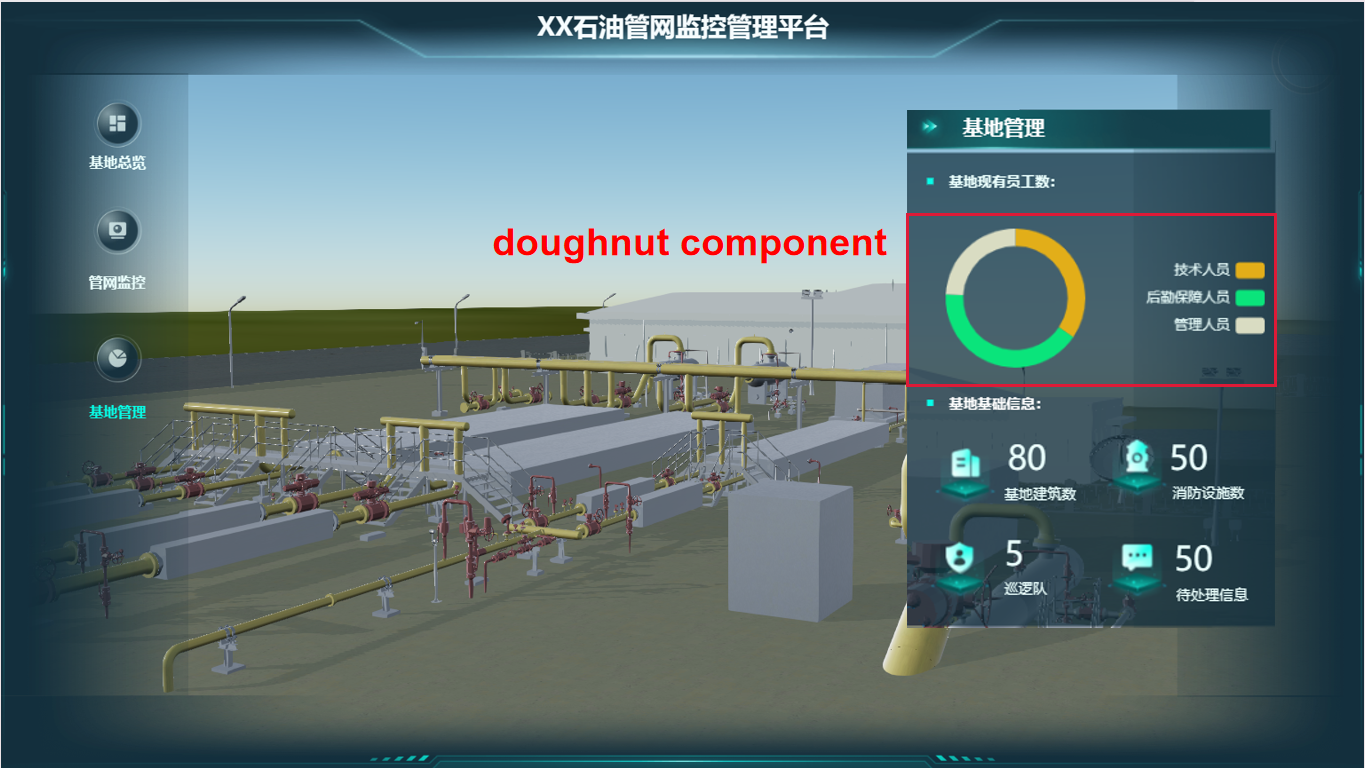
Base management page
In order to query and see the information of the key facility in the scene, you can implement the function of click and query in the low-code editor. In the master page, click the ![]() icon in the top navigation to open the low-code editor.
icon in the top navigation to open the low-code editor.
Step 1: Create pop-up for scene
In the default HTML file, create a div for pop-up, which include text content and image.
<div class="popup-panel" style="left: -2000px">
<div class="popup-content">
<div class="row">
<span class="field">Name:</span><span class="fieldValue">xxx</span>
</div>
<div class="row">
<span class="field">Text:</span><span class="fieldValue">xxx</span>
</div>
<div class="row">
<span class="field">Text:</span><span class="fieldValue">xxx</span>
</div>
<div class="row">
<span class="field">Descrption:</span><span class="fieldValue">xxx</span>
</div>
</div>
<div>
<img src="./static/material/image/icon77.png" alt="" />
</div>
</div>
Step 2: Set style of pop-up
In the default CSS file, set the style of pop-up.
/* set overall style of Pop-up panel */
.popup-panel {
position: absolute;
width: 318px;
height: 178px;
display: flex;
align-items: center;
justify-content: space-around;
background: url("./static/material/image/image182.png");
background-size: 100% 100%;
z-index: 1000;
}
/* set style of field in pop-up */
.field {
text-align: right;
width: 100px;
display: inline-block;
font-size: 18px;
color: #fff;
margin-right: 10px;
}
/* set style of field value in pop-up */
.fieldValue {
color: #0bdac8;
}
/* set style of row in pop-up */
.row {
margin-top: 5px;
margin-bottom: 5px;
}
/* set style of cesium container in pop-up */
#CesiumContainer {
height: 1000px;
}
Step 3: The interaction between scene and pop-up
In the default JavaScript file, write code to implement the capability: click icon in the scene and pop up a pop-up to show the introduction.
(1)Create a point array to save the position and introduction of each point.
const popupData = [
{
id: "12321321",
name: "加热系统A组",
pressure: "1.7MPa",
temperature: "40℃",
position: {
x: -2145079.0533637507,
y: 4396986.518819796,
z: 4078489.255347335,
},
status: "检修正常",
},
{
id: "43244324",
name: "双层油罐A",
pressure: "0.4MPa",
temperature: "20℃",
position: {
x: -2145125.285043284,
y: 4396948.1269793175,
z: 4078504.9809848587,
},
status: "检修正常",
},
{
id: "43764325",
name: "计量装置",
pressure: "1MPa",
temperature: "22℃",
position: {
x: -2145128.38504491,
y: 4396969.504125927,
z: 4078481.0211254675,
},
status: "检修正常",
},
{
id: "43764328",
name: "止回阀A",
pressure: "1MPa",
temperature: "25℃",
position: {
x: -2145100.829913399,
y: 4396964.858135207,
z: 4078499.8815421904,
},
status: "检修正常",
},
{
id: "43764326",
name: "无缝钢管1",
pressure: "1.6MPa",
temperature: "40℃",
position: {
x: -2145093.1001131386,
y: 4396994.879339555,
z: 4078473.903918814,
},
status: "检修正常",
},
];
(2)Create a function 'addEntity()' to load the point object into the scene as an icon.
// Load point entity in secne
function addEntity(e) {
e.map(res => {
let poin = $WebScene_99.viewer.entities.add({
id: res.id,
name: res.name,
position: res.position,
billboard: {
height: 50,
width: 50,
image: './static/material/image/image142.png',
disableDepthTestDistance: 100
}
})
})
return e
}
// Add point entity
setTimeout(() => {
addEntity(popupData);
}, 2000);
(3)Create a function 'updatePopupPosition()' to update the position of pop-up. And when you click the icon, the pop-up will be displayed in the scene.
// Get the DOM node of the pop-up
var bableLightDom = document.querySelector(".popup-panel");
// Define click position and click id in the scene
var clickPosition = null;
var clickId = null;
// load pop-up on the click position
$WebScene_99.viewer.screenSpaceEventHandler.setInputAction((e) => {
let pick = $WebScene_99.viewer.scene.pick(e.position)
if (pick.id.name) {
// var position = $WebScene_99.viewer.scene.pickPosition(e.position)
clickPosition = pick.primitive.position;
clickId = pick.id.id;
updatePopupPosition(pick.primitive.position, pick.id.id)
} else {
bableLightDom.style.left = '-2000px';
}
}, SuperMap3D.ScreenSpaceEventType.LEFT_CLICK)
// The function of updating pop-up position
function updatePopupPosition(position, id) {
var WindowCoordinates =
SuperMap3D.SceneTransforms.wgs84ToWindowCoordinates(
$WebScene_99.viewer.scene,
position
)
let targetData = popupData.find((info) => {
return info.id === id
})
var content = document.querySelector(".popup-content")
content.innerHTML = ""
Object.keys(targetData).forEach((key) => {
if (key !== "position") {
const row = document.createElement("div")
row.className = "row"
const field = document.createElement("span")
field.className = "field"
const newkey = key.charAt(0).toUpperCase() + key.slice(1)
field.innerText = `${newkey}:`
const fieldValue = document.createElement("span")
fieldValue.className = "fieldValue"
fieldValue.innerText = targetData[key]
row.appendChild(field)
row.appendChild(fieldValue)
content.appendChild(row)
}
})
let rect = $WebScene_99.viewer._container.getBoundingClientRect();
let out = document.querySelector('.sm-container');
let top = WindowCoordinates.y - bableLightDom.offsetHeight - 10 + rect.top;
let left = WindowCoordinates.x - bableLightDom.offsetWidth / 2 + rect.left;
if (out) {
let outRect = out.getBoundingClientRect();
top = top - outRect.top;
left = left - outRect.left;
}
bableLightDom.style.top =
top + "px"
bableLightDom.style.left =
left + "px"
}
(4)In the default JavaScript file, select 'Scene 1' in the 'Scene' drop-down menu in Global Variable. Click '+' next to 'Scene 1', select 'Scene Event' > 'After render(postRender)' to generate event code in the Code editor. The event code is as follows:
$WebScene_99.viewer.scene.postRender.addEventListener((e) => {
if (clickPosition && clickId) {
updatePopupPosition(clickPosition, clickId)
}
});
Step 4: Preview pop-up effect
Click the 'QuickRun' button to run code, you can view the pop-up effect in edit mode as shown in the following image.
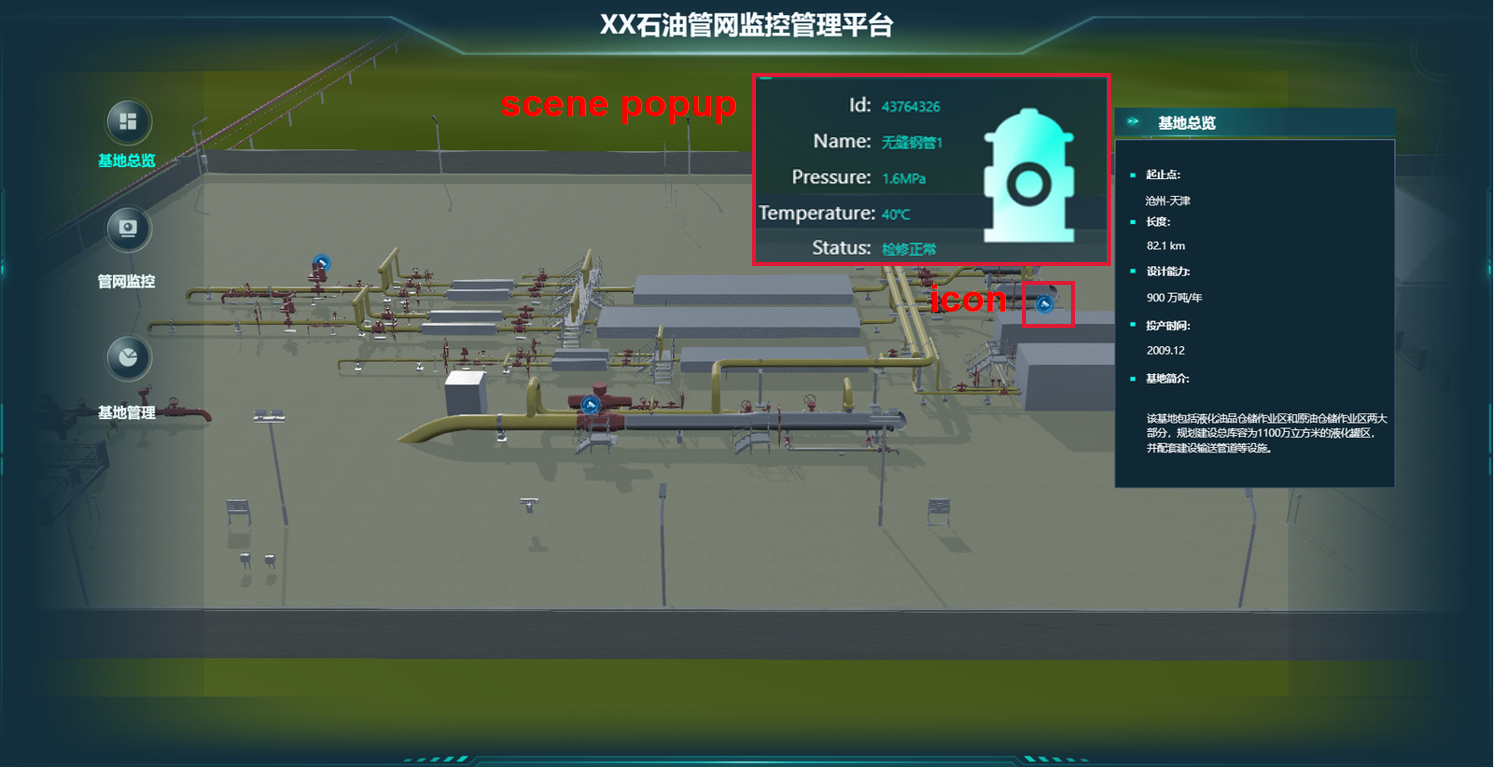
Pop-up effect
When the dashboard setup is done, click the ![]() icon in the top navigation bar to preview the dashboard on desktop. You can click page names on the left to switch page, and different pages will display different angle of scene and different thematic information. The effect of each page is as follows.
icon in the top navigation bar to preview the dashboard on desktop. You can click page names on the left to switch page, and different pages will display different angle of scene and different thematic information. The effect of each page is as follows.
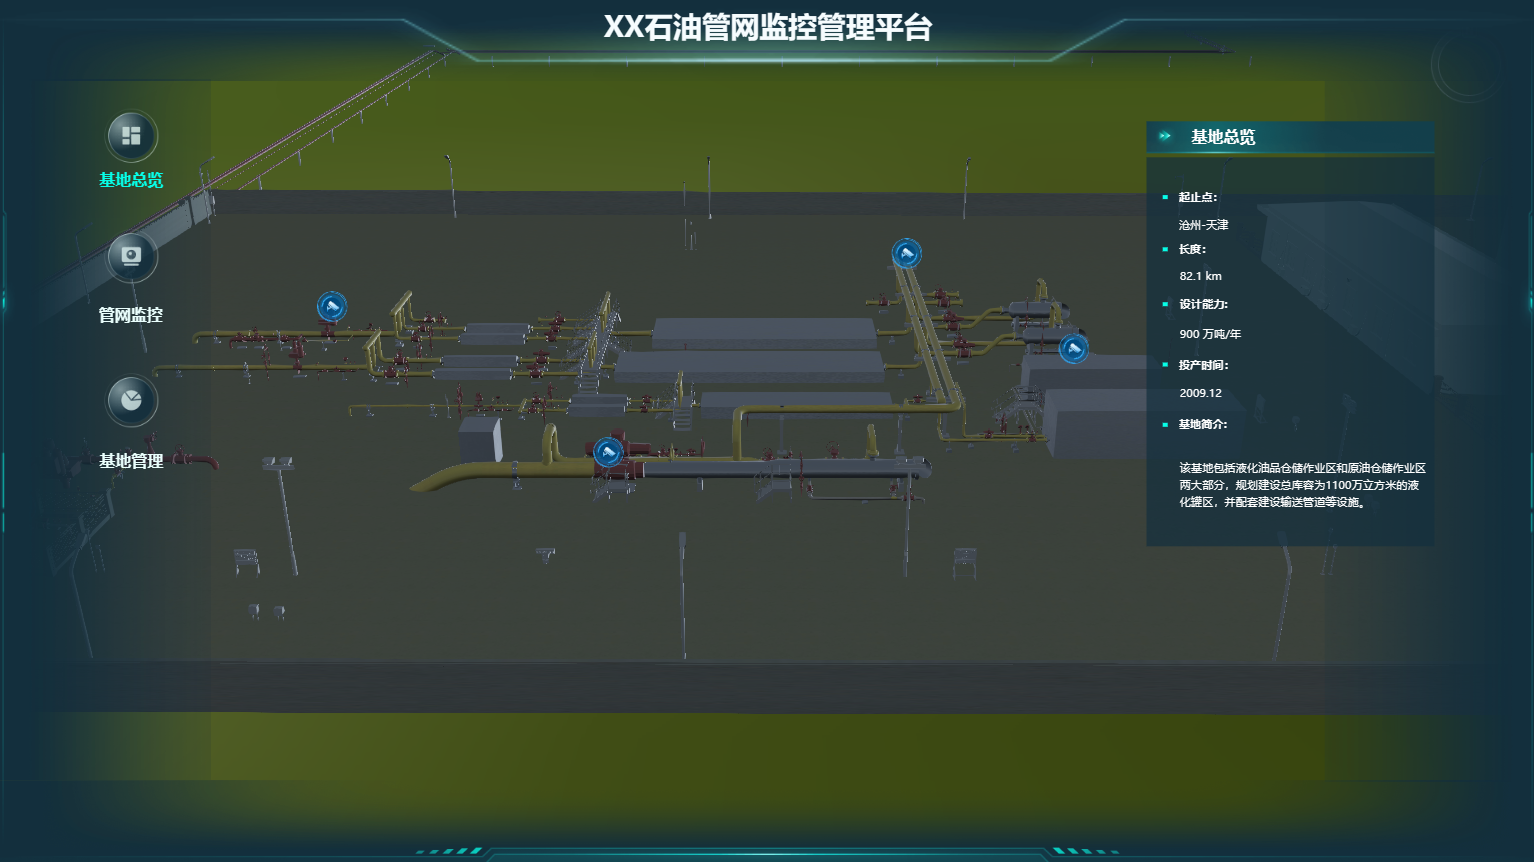

Click the ![]() icon on the upper right corner of MapDashboard page and select 'Save' to save the created dashboard. You can edit the title, label, and description of the dashboard when saving (it). If you need to set permissions of the dashboard, or publish/download it, see: Preview, Save, and publish.
icon on the upper right corner of MapDashboard page and select 'Save' to save the created dashboard. You can edit the title, label, and description of the dashboard when saving (it). If you need to set permissions of the dashboard, or publish/download it, see: Preview, Save, and publish.