Getting started |
Learn the following basics before using DataInsights:
Before using DataInsights, the SuperMap iPortal license and DataInsights Extension Module license are required. To view the license of your current iPortal, see: Licensing information.
Additionaly, the users need to be granted with the DATA_CENTER role. For details, see: Roles and permissions.
Once you have the DataInsights license and DATA_CENTER role, you can start your DataInsight journey. After logging in to iPortal, you can access the DataInsights WebApp in the following ways:
On the Resource Center > Insight page, click Create Insights on the right
On the "App Center" page, click the DataInsights logo on the left sidebar, and click "New" on the welcome page on the right to enter the DataInsights page
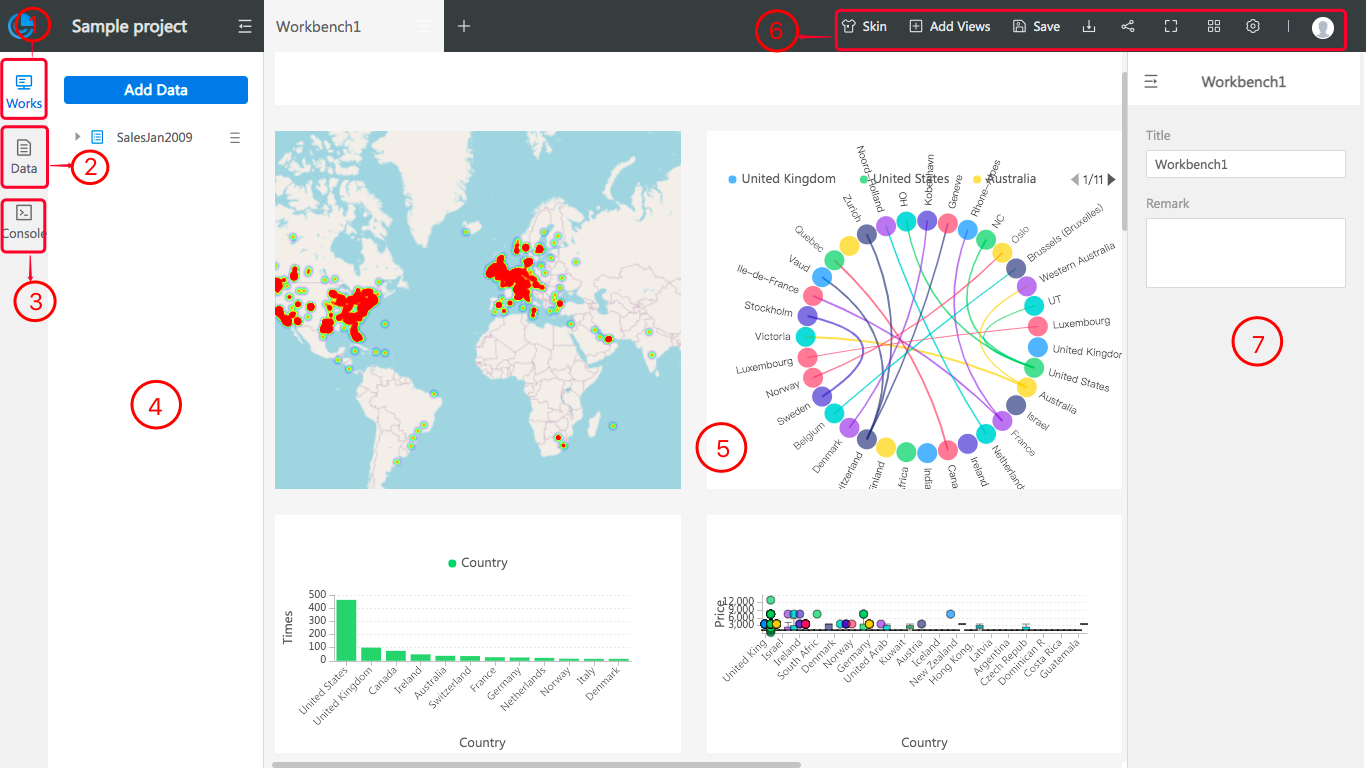
The DataInsights page is as follows. Here we take a brief introduction.

 to the right of data can update it, export it as a local file, or remove it from DataInsights.
In the navigation bar of SuperMap iPortal home page, click DataInsights tab to enter DataInsights, where you can add data, create views, perform analysis and share results.
Adding data supports these ways, by uploading local Excel, CSV or GeoJSON data, by using the sample data provided by the system, or using the data from My Data, or the dataset of My Service. Once added the data you want to use, you can visualize them on map, or charts, or use the analysis functions. For details about adding data, see: Add data.
When the data is loaded, the system automatically determines the type of all fields. You can create views from the fields, each of which creates two kinds of views: a map and a chart. The linkage display between created maps and charts is opened by default. You can open/close in the View Setting at the upper right bar. For details about creating views, see: Create view.
Once created a map view with the data you added, you can explore more values with various analysis functions. For details, see: Perform analysis.
The spatial analysis results are automatically stored in "My Data" as a data table. You can download the spatial analysis results or share the analysis results with other iPortal users or applications. For details, see: Share analysis results.
To have a more clear understanding of how to use DataInsights in real scenario, see: Application case.
The workbench supports Light/Dark Theme; data supports to export to local; the created insights results can be exported as PNG or PDF, shared via link, QR code or embedded to other page via iFrame. And the shared insights supports to be displayed in Lantern Slide. For details, see: DataInsights settings and sharing.