Mapping performance statistics |
SuperMap iServer supports statistical function of image output data, which supports that a user checks the performance data of every part of code when server responds to every image output request (such as time cost) and the total methods number that are called when processing every request, in a way of visualization.
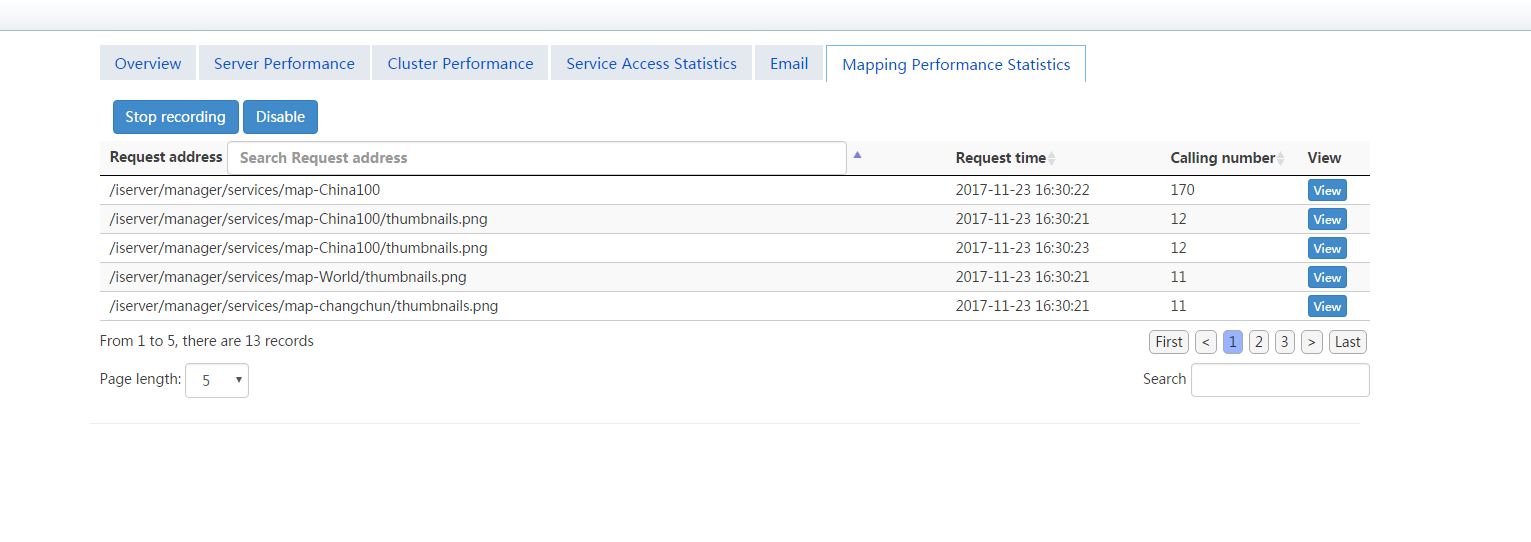
Visit SuperMap iServer Manager,click Monitoring>Mapping Performance Statistics tab in order, entering the page of Mapping Performance Statistics (http://localhost:8090/iserver/manager/serverstatus/methodstatistics), you can see the total number of methods that are called when current server is processing every request. If you want to see the detail of request and call of every image output request, such as method description, time cost, and whether exception happens or not, you just need to click the View button. The detail of request and call is shown as following:
You can also choose to enable or disable this function based on your own need. After clicking Disable button, you need to restart service, to bring the setting into effect. After restarting service, server will not record related data in "Mapping performance statistics" page as next image output request comes; After clicking Enable button, you also need to restart service to bring it into effect. After restarting service, server will record all image output requests related performance data during the recording period. When you want to get image output performance data again, you just need to click Start recording button. Image output data statistics page is shown as following: