Configuring KML styles |
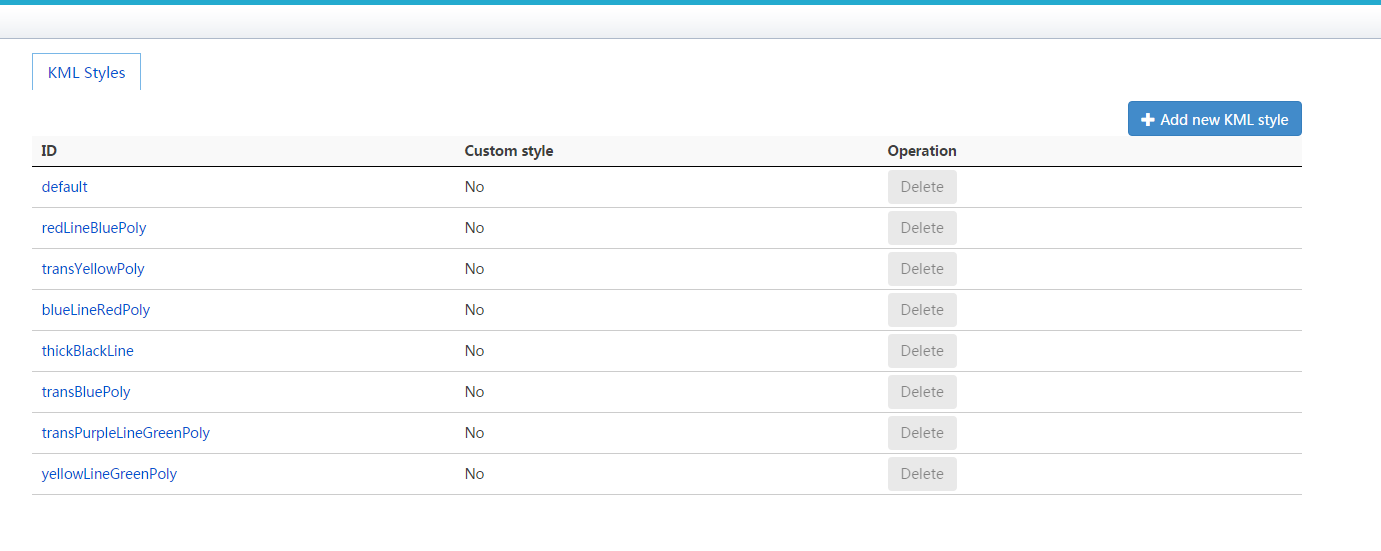
SuperMap iServer can configure different KML styles according to the vector data corresponding to the already published workspace to represent different vector information displayed in 3D scene.
The specific methods are:

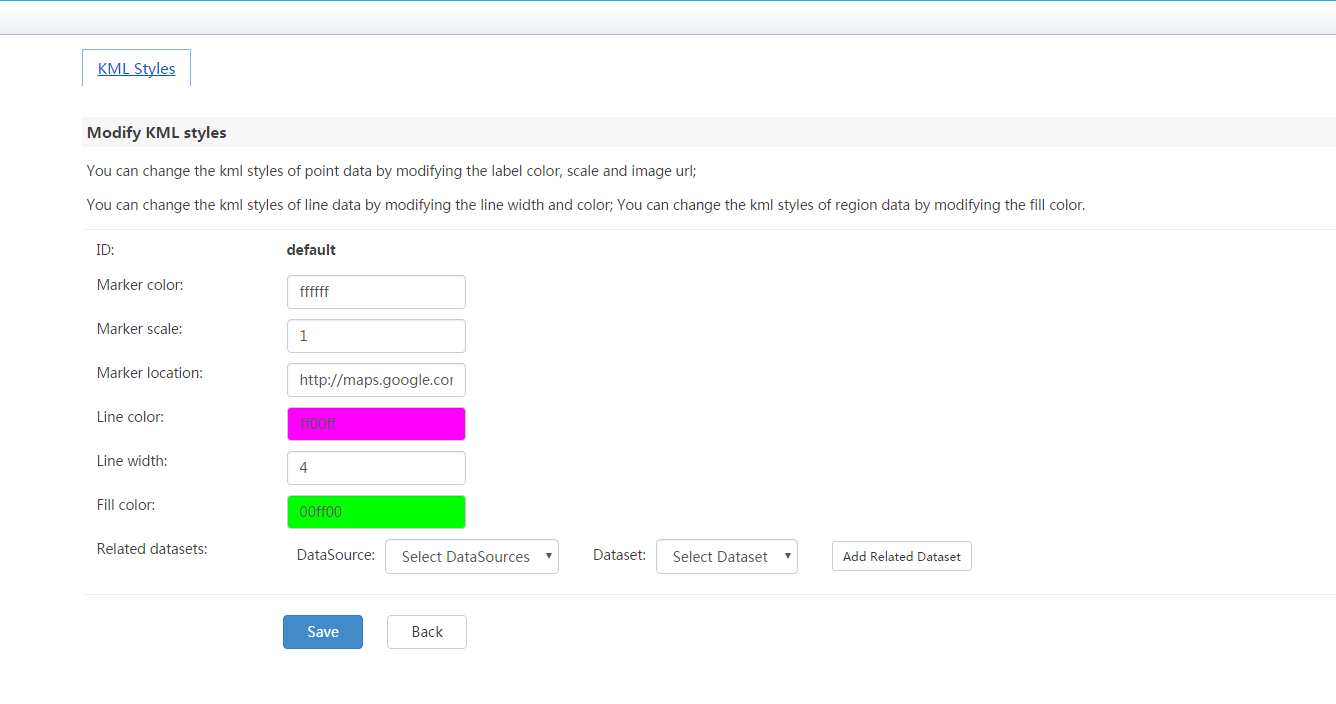
In these styles, the icon scale refers to the ratio of the icon relative to original picture size; the icon path is the network access location of the image, such as http://maps.google.com/mapfiles/kml/pal3/icon19.png, the image shown as:![]() ; Users can also customize a picture placed in the % SuperMap iServer_HOME% \webapps\iserver directory and of any directory of % SuperMap iServer_HOME%\webapps\iserver\resources, for example, if users want to use an image named icon30.png
; Users can also customize a picture placed in the % SuperMap iServer_HOME% \webapps\iserver directory and of any directory of % SuperMap iServer_HOME%\webapps\iserver\resources, for example, if users want to use an image named icon30.png![]() , and can put this image in % SuperMap iServer_HOME% \ webapps \ iserver \ resources \ images directory, and then sets the label image address as http://iserver:8090/iserver/resources/images/icon30.png. The color used is hexadecimal, after editing, the text box will automatically display the color, such as ff0000 displayed red in Google Earth, 00ff00 shown as green, while ff00ff shown as magenta.
, and can put this image in % SuperMap iServer_HOME% \ webapps \ iserver \ resources \ images directory, and then sets the label image address as http://iserver:8090/iserver/resources/images/icon30.png. The color used is hexadecimal, after editing, the text box will automatically display the color, such as ff0000 displayed red in Google Earth, 00ff00 shown as green, while ff00ff shown as magenta.
The default style is the default point, line, polygon display style: The label color is white, and the ratio is 1, the used image address is http://maps.google.com/mapfiles/kml/pal3/icon19.png; the line color is purple, and the line width is 4; the fill color within the polygon is green. In the default settings, opens the KML service published by SuperMap iServer in Google Earth, and then the style will be displayed.
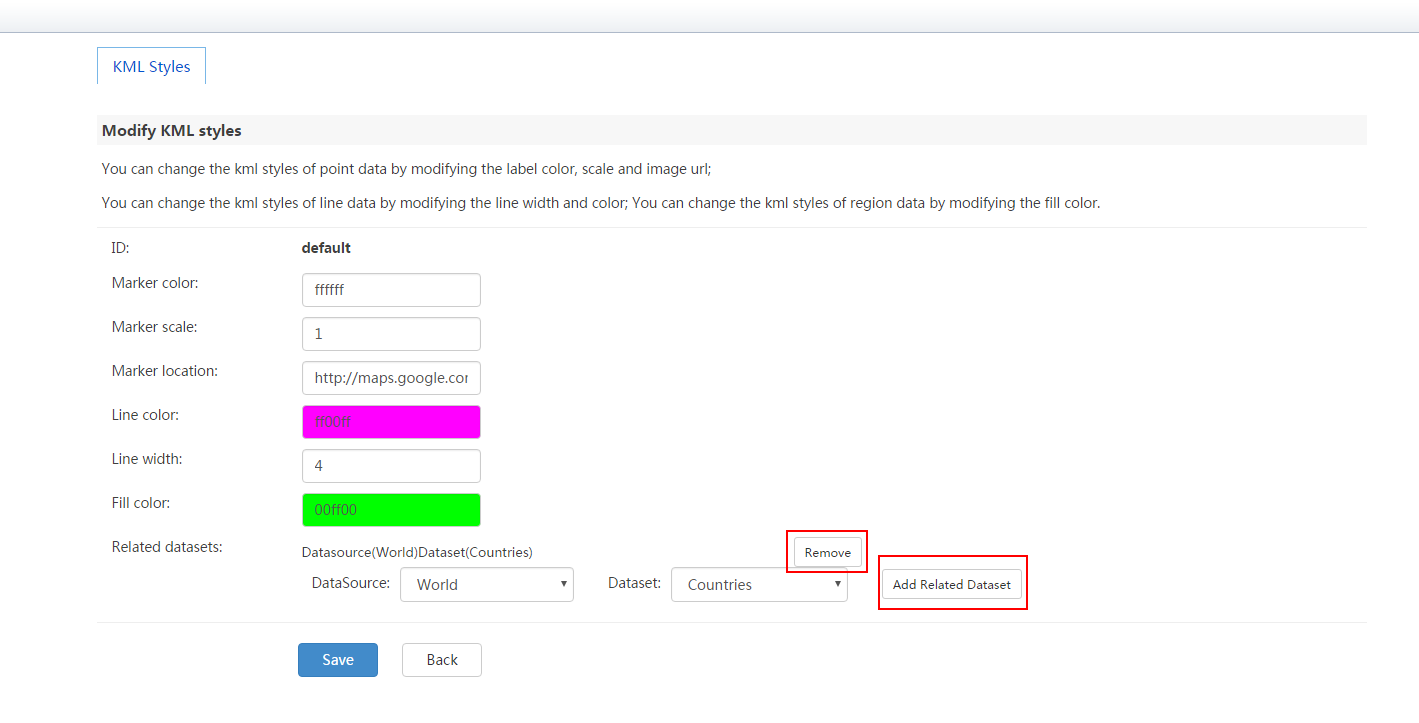
Select the data source already published in the Related datasets dropdown list, and select the dataset to perform the style setting, and then click Add related dataset button to add this dataset to the list. You can click Remove after the related dataset to remove it. To save the configuration, click Save.
Click the Cancel button and returns to the previous page.
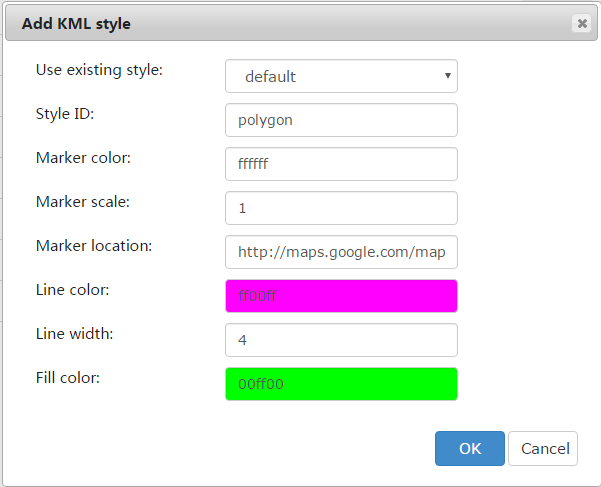
If it is a point dataset, you can only set the icon color, icon scale, and icon path; if it is a line dataset, you can onlyset the line color and line width; if it is a region dataset, you can only set the fill color. Also you can select an existing style from the drop-down list of the Use existing style, then parameters related to the style will be filled in the corresponding text boxes. Below shows adding a style named "polygon" using the existing default style "default".
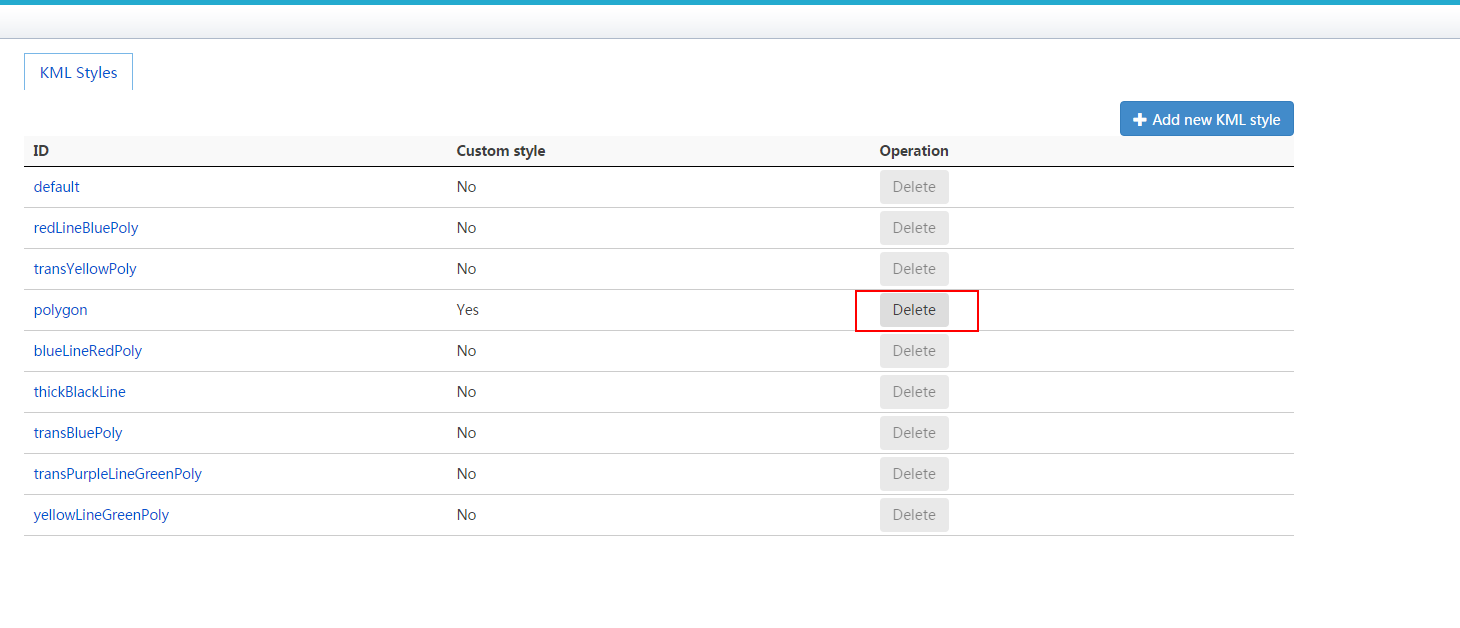
Repeat step 3 to modify the style settings, and then add associated datasets for this style.