Build the model |
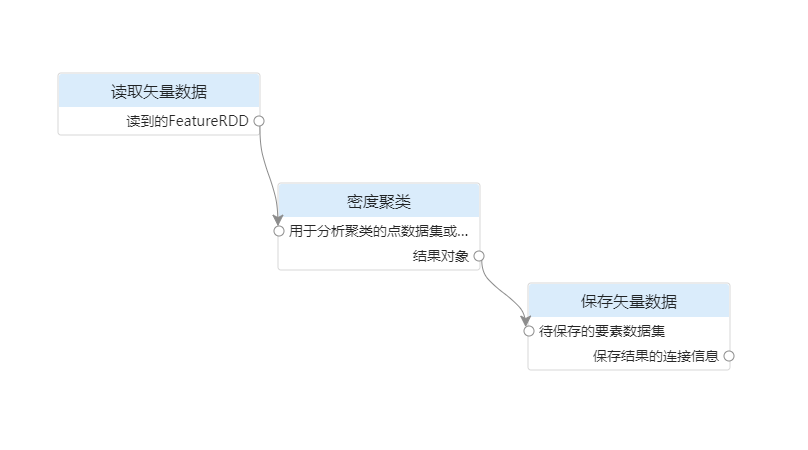
To perform density clustering analysis on urban POI data, it is necessary to read the analyzed data, then analyze the read data, and then save the resulting data obtained from the analysis.
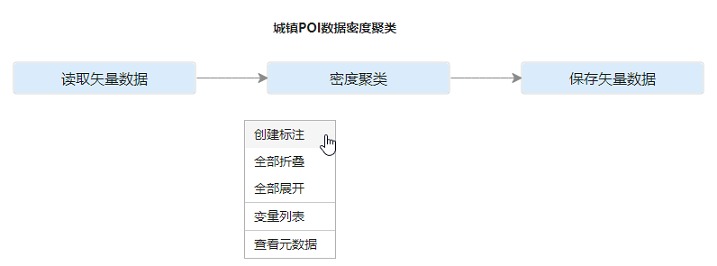
The model consists of three tools: reading vector data, density cluster analysis, and saving vector data, as shown in the figure:
Processing automation tools can be added in the following ways:
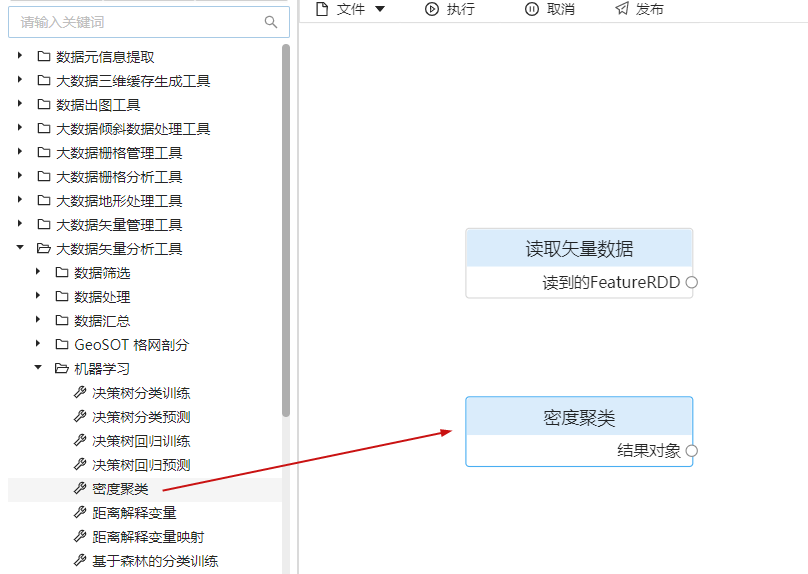
Drag-and-drop process automation tools into the canvas support movement and manipulation:
A model usually needs to be composed of multiple processing automation tools, and connections need to be established between the tools. The main operations for drawing connections are:
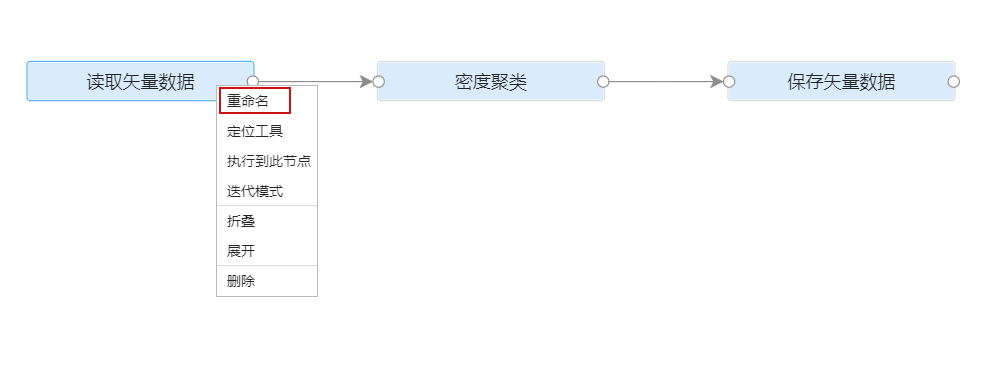
When the model contains multiple tools with the same name or the tool name does not match the usage scenario, you can click the left mouse button to select the tool node, and select "Rename" in the right-click menu to rename the tool.
When there are too many tool parameters or too many tools, the visual modeling page will appear cluttered. You can right-click the blank area of the canvas and select the "Collapse All" button to collapse the tool parameters. The folded tools also support movement.
At the same time, you can also select "Horizontal Auto Layout" or "Vertical Auto Layout" in the menu on the right side of the canvas to neatly layout the canvas. Through these operations, the display of visual modeling can be optimized.
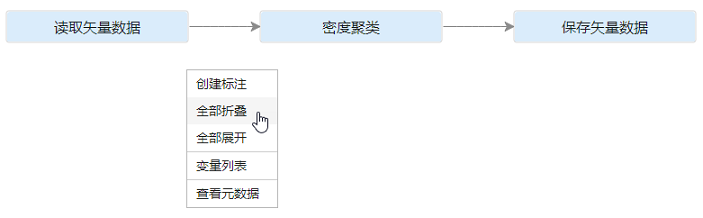
When the model is complex, the business process is not easy to understand. You can add annotations to the model elements to improve the legibility of the model. To add annotations to the model, just right-click on the blank area of the canvas and select "Create Annotation". In addition, you can also add a label to a single tool node, click the left mouse button to select the tool node, and select "Create Label" in the right-click menu. The label added to the tool node can be moved together when the tool node is moved.
In addition, the xml template for visual modeling can also be imported into the canvas for modeling through File->Import Model.