iServer Concepts |
For your better understanding of SuperMap iServer, this section gives the definition of fundamental concepts, mainly including workspace, datasource, map, layer, thematic map, etc.
Workspace
A workspace is where you work with your data, mainly responsible for data organization and management, including opening, closing, creating and saving workspace files. Workspaces make data management convenient.
A workspace stores all the datasources, maps, and their relationships of a project. A workspace manages the datasources and maps in it through the collections of datasources and maps.
Datasources: The collection of datasources storing the logic connection information of the datasources. All datasources are stored in databases or UBD physically. Only when connection is built, a datasource can be accessed. Datasources can seamlessly manage multiple types of datasoruces.
Maps: The collection of maps storing the configuration information of the maps, including the number of layers, the datasets referenced by the layers, the background styles of the layers, etc. Only the map in the current workspace can be accessed.
In the current version, one application can have several workspaces, and each workspace can manage a set of datasources and maps. Interoperations are not supported between workspaces. The advantages of the coexistence of multiple workspaces are:
Making sure users can dynamically access workspaces and publish dynamic data;
Providing assurance for security control. Users of different levels or with different authorities can access different workspaces, avoiding misoperations.
Datasources
The collection of datasoruces manages datasources, including creating, opening, closing datasources A datasource can seamlessly manage datasources of different types (UDB, Oracle, SQL).
In the current version, datasource collection supports multithread access.
Datasources in a workspace are all managed by Datasources. When creating a datasource, you should be aware of the type of datasource and corresponding data engine.
Datasource
A datasource is where you store spatial data.. All the spatial data is stored in the data source rather than the workspace.. Any operation on spatial data needs to open or acquire datasource. Datasource can manage the connection between datasource and file or database, the projection of datasource, etc.
A data source corresponds to a data engine. SuperMap products provide several kinds of datasource types, including file datasource and database datasource. SDB datasource belongs to file datasource, Oracle and SQL datasource belong to database datasource.
The data source only defines a consistent data access interface and specification, and does not define the storage details of the datasource. The physical storage of datasource can be file or database, the way to distinguish them lies in the data engines they adopted. Using SDB engine, datasource will be stored as file mode(*.sdb, *.sdd), while using the spatial data engine, datasource will be stored in specified DBMS.
Characteristics
SuperMap provides two ways to connect datasources and databases: manual and automatic. If users choose automatic connection, datasource would connect to the data stored in the database automatically when opening a workspace, but the dataset stored in the database is closed, users need to open the dataset for operations(Users can open the dataset by calling the Open method provided by class dataset); Users who do not choose automatic need to make the connection manually.
Datasets
The dataset collection provides management functions for datasets, such as creating, deleting, renaming, and so on. All dataset objects in a datasource are managed by a dataset collection object.
Datasets contains one or more types of datasets, which could be vector or grid datasets, such as point datasets, line datasets, region datasets, grid datasets, image datasets, network datasets, etc.
Dataset
Dataset is the collections of data of the same type, such as point and line datasets. According to the types of the data, dataset can be divided into vector datasets, grid datasets, image datasets, and datasets designed for specific problems such as lineM datasets and network datasets. According to data structure, dataset types in SuperMap are divided into: point datasets, line datasets, region datasets, tabular datasets, network datasets, CAD datasets, text datasets, lineM datasets, image datasets, and grid datasets. Point datasets, line datasets, region datasets, tabular datasets, CAD datasets, text datasets are vector datasets.
A dataset is a basic unit for spatial data organization, and can be displayed in a map window as a layer. You can edit a dataset in a map window, such as move the geometric objects to a new position, obtain a line dataset through vectoring an image dataset, etc.
Vector dataset
The collection that stores and manages vector data. In vector data model, entities in the real world are represented by point, line and region with coordinates, and we often use topology to describe the relationship between them. Usually, point, line, region and text datasets belong to vector datasets.
Vector dataset is the collection of spatial features of the same type, so it can also be called feature dataset. According to different spatial characteristics of the feature, vector datasets can be divided into point datasets, line datasets, region datasets, etc. Data with the same spatial characteristic and property are organized in one dataset.
Tabular dataset
Tabular dataset stores and manages the collection of pure attribute data. The tabular dataset is mainly used to store and manage the pure attribute data that describe the information of the characters and shapes of the surface features, such as the length and width of the river. This dataset does not contain graphics data in it, namely the dataset cannot be displayed in the map window as a layer. In SuperMap, you can join and link tabular dataset with other vector datasets for further operation.

Point dataset
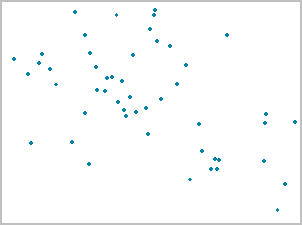
A point dataset is used to store point objects.
Line dataset
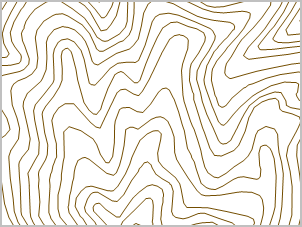
The line dataset is used to store the line objects, such as the river, boundary and road.
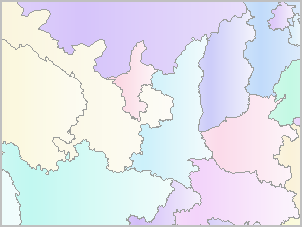
Region dataset
The region dataset is used to store the region objects, such as distributing of the house and administrative region. The biggest difference between region objects and line objects is closeness and the fill style of the layers.
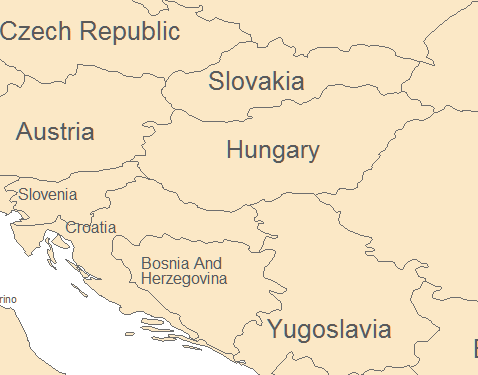
Text dataset
The text dataset is used to store the text objects, such as the text of the annotation.
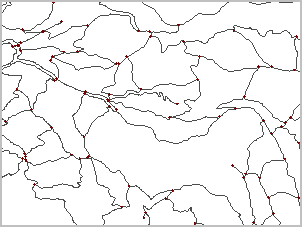
Network dataset
The network dataset is used to store the dataset with topological relationship in network, such as the transportation network.
The network dataset is different from the point dataset and the line dataset. The network dataset contains the line objects, the node objects and the topological relationship between them.
The network dataset is used for network analysis such as finding the shortest path, performing a service area analysis, closest facility analysis, allocation analysis, location-allocation analysis, bus transfer, adjacent node and connected node analysis.
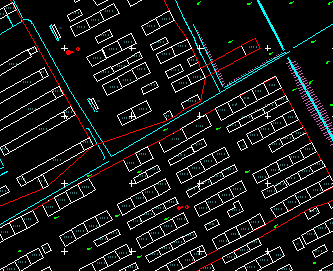
CAD dataset
The CAD dataset is a dataset that can store multiple geometric objects. You can put point, line, region and text in a data set While point datasets, line datasets, surface datasets, and text datasets can only store the same type of geometry object.
Advantages: Can store parametric geometry object. For example:as for a circle, CAD dataset just stores X, Y values and radius of the circle, while the simple dataset needs to store all the X, Y values of the circle's ordered point.
Tips: When convert CAD dataset to simple dataset, parametric object would be scattered, and corresponding point created for storage.
Besides, all the objects in CAD dataset can store their original styles, just as text dataset, while point, line, region dataset do not store objects' styles. When displaying, CAD dataset shows original styles of data, while simple dataset decide display style according to the layer style or thematic map.
LineM dataset
The LineM dataset can only be used in network analysis, as the event measure value is to be marked.
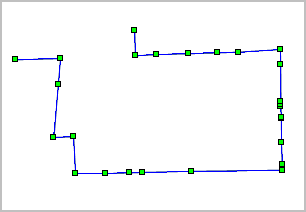
Image dataset
The image dataset belongs to the raster dataset, such as image map, multi-wave image and photo. The image dataset is used to be displayed or used as the base map, so the value of a cell is the value of a color or the value of an indexed color.

Grid dataset
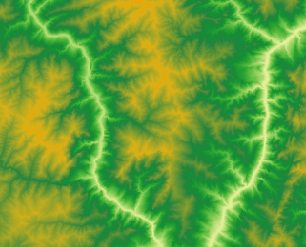
The grid dataset is mostly used to do some analysis based on raster, so the value of a cell represents certain attribute of a geographic feature, such as elevation, rainfall, etc.
Recordset
Recordset is the basic operation unit of SuperMap, composed of one or more records. Each record correspond to a geometric object and its attribute information.
Generally, recordset is the collection of all or most records in one dataset, usually selected from the dataset according to certain conditions. You can select from either the rows or columns, or both of them. If you add, modify or delete a record in recordset, data in the dataset will change correspondingly.
Records in spatial data are different from that of Management Information System: records in spatial data generally have a special geometric field to store spatial information of the geometric object. And also some system fields which are essential for GIS software platform. In SuperMap GIS , they are fields start with "sm". These fields are not allowed to be modified unless announced in particular. Records in MIS don't have these characteristics.
Geometry object
Geometry objects are representations of entities in the real world, such as point, line, region, text, etc.
Field
Field is a column in the attribute table, which stores some attribute values. Users can access the value through field name or field index.
Map
A map is composed of a set of ordered layers. Generally, a layer references only one dataset while a dataset can be added to a map for several times with different drawing styles. Layers in the map have information like name, drawing style, view scope, layer status and layer order, etc. When saving the map, these information will be saved, too.
Maps
Maps are stored in workspace, the collection of maps in a workspace is called Maps Maps exist in workspace, all maps that are created in this workspace or reference data from this workspace are managed by this Maps.
Map window
Map window is the window to display maps. A map can be opened in a map window, while several layers can be overlaid in a map window and saved as a map. Layer(s) displayed in the map window is called map. .And the window is just a place to display map temporally, not save the map. If the window is closed, the map in it is not exist. But if you save the map to a workspace, then you can open it at anytime.
Datasets in a map derived from datasource. If you delete the datasource, the corresponding map will not exist. Next time you open the map, an error will occur to tell you the is no data in the workspace. Besides, if you edit the dataset in a map, the map will also be updated after refreshing. The conception of map is just like "view" in relational database, map doesn't store dataset, it's just a part of workspace, a definition of visualization. To save the map, you need to save the workspace.
Map symbol and style
Maps convert spatial information through map symbol system. Map after symbolizing is thematic map. Map symbols include marker, line and fill symbol. The style setting of label text is also a part of map symbolization. Text symbol is used to draw feature name and other attributes.
Marker symbol
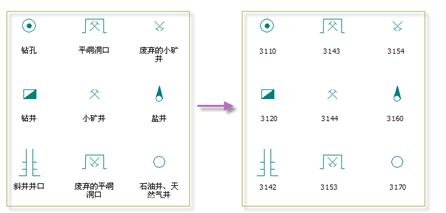
The style settings of marker symbol include ID, size, rotation angle and color. There are more than 1000 predefined marker symbols for engineering in SuperMap marker symbol library. Each symbol has an ID and name, the picture shows part of the symbols.
Line symbol
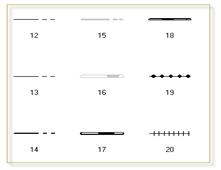
The style settings of line symbol include ID, width and color. There are about 50 predefined line symbols in SuperMap. Each symbol has an ID, the picture shows part of the symbols.
Fill symbol
The style settings of fill symbol include fill and border style. The settings of border and line style are the same, and the fill style includes two modes: common fill mode and gradient fill mode.
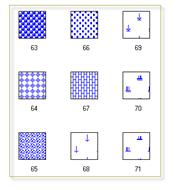
The style settings of common fill mode include fill symbol ID, forecolor, backcolor and transparency of background. There are about 100 predefined fill symbols in SuperMap.Each symbol has a unique ID, the picture shows part of the symbols.
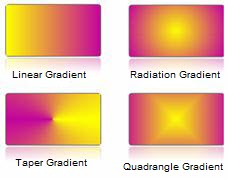
The style settings of gradient fill mode include gradient fill pattern, forecolor, backcolor, gradient angle and gradient offset. SuperMap provides four gradient patterns: linear, radial, conical, and rectangular, all of which are 2-color gradients. Different patterns have different effects. The forecolor and backcolor are respectively used to specify the start color and end color of the gradient. The default rotation angle is 0, user can set the angle to make the gradient rotate. As for radial gradient, the effect will not change no matter how it is rotated because of cetrosymmetry .Except for linear gradient, users can change the effect of gradient map by offsetting the center of radial gradient, apex of the cone and center of the rectangle.
Text symbol
The style settings of text include font, alignment, font size, font height, font width, font rotation angle, forecolor, backcolor, etc.And other font effects such as bold, italic, shadow, outline, strikethrough, transparent, etc.
Map projections and coordinate systems
In SuperMap, dataset with the same coordinate system can be opened in the same map window, or do integrated analysis like overlay. There are two kinds coordinate system in GIS: geographic coordinate system and projected coordinate system. A projected coordinate system is always based on a geographic coordinate system that is based on a sphere or spheroid.
Geographic coordinate systems
A geographic coordinate system (GCS) uses a three-dimensional spherical surface to define locations on the earth. A GCS includes an angular unit of measure, a prime meridian, and a datum (based on a spheroid).
Longitude and latitude are angles measured from the earth's center to a point on the earth's surface. The angles often are traditionally measured either in decimal degrees or in degrees, minutes, and seconds (DMS). In the spherical system, horizontal lines, or east-west lines, are lines of equal latitude, or parallels. Vertical lines, or north-south lines, are lines of equal longitude, or meridians. These lines encompass the globe and form a gridded network called a graticule. The line of latitude midway between the poles is called the equator. It defines the line of zero latitude. The line of zero longitude is called the prime meridian. For most geographic coordinate systems, the prime meridian is the longitude that passes through Greenwich, England. Other countries use longitude lines that pass through Bern, Bogota, and Paris as prime meridians. The origin of the graticule (0, 0) is defined by where the equator and prime meridian intersect. The globe is then divided into four geographical quadrants that are based on compass bearings from the origin. North and south are above and below the equator, and west and east are to the left and right of the prime meridian.
Spheroid
People usually use the sphere or spheroid to describe the shape and size of the earth, sometimes for the sake of calculation, you can see the earth as a sphere, but more often it is regarded as an spheroid. The assumption that the earth is a sphere is possible for small-scale maps (smaller than 1:1, 000, 000). At this scale, the difference between a sphere and a spheroid is not detectable on a map. However, to maintain accuracy for larger-scale maps (scales of 1:1, 000, 000 or larger), a spheroid is necessary to represent the shape of the earth. The spheroid is elliptical, so the size of the earth sphere is expressed by two axes, the long axis (equatorial radius) and the minor axis (polar radius). A spheroid is traditionally defined by the semimajor axis and the flattening. The flattening is the difference in length between the two axes expressed as a fraction or a decimal. Flattening describes the shape of a spheroid, the larger the value, the flatter the earth.
The earth has been surveyed many times to better understand its surface features and their peculiar irregularities. The surveys have resulted in many spheroids that represent the earth. Generally, a spheroid is chosen to fit one country or a particular area. A spheroid that best fits one region is not necessarily the same one that fits another region. North American continent use a spheroid determined by Clarke in 1866. The semimajor axis of the Clarke 1866 spheroid is 6, 378, 206.4 meters, and the semiminor axis is 6, 356, 583.8 meters, while China uses spheroid determined by Krasovsky in 1940. The semimajor axis of the Krasovsky 1940 spheroid is 6378245.0 meters, and the flattening is 0.003352330. SuperMap provides more than 100 Spheroids, users can choose one to fit the particular area.
Datum
While a spheroid approximates the shape and size of the earth, a datum defines the position of the spheroid relative to the center of the earth. A datum determines the position of the Earth's spheroid relative to the Earth's sphere, providing a reference frame for the measurement of surface features, and determining the origin and direction of the surface latitude and longitude network. The datum takes the center of the earth spheroid as the origin. The geo-spheroid of a region's datum is more or less biased away from the true center of the earth. It is as much as possible to describe the surface condition of the area, and the coordinates of the earth's surface are relative to the center of the spheroid. At present the most widely used datum is WGS84, it is seemed as the basic frame of reference for measuring locations on the surface of the earth. Different datums apply to different countries and regions. A datum is not suitable for all regions. As the AD27 is suitable for the North American land, the ED50 is suitable for the European continent.
Projected coordinate systems
A projected coordinate system is defined on a flat, two-dimensional surface. Whether you treat the earth as a sphere or a spheroid, you must transform its three-dimensional surface to create a flat map sheet. This mathematical transformation is commonly referred to as a map projection. The projection coordinate system is a plane coordinate system. Different projections cause different types of projected coordinate system. A projected coordinate system is always based on a geographic coordinate system that is based on a sphere or spheroid.
In a projected coordinate system, locations are identified by x, y coordinates on a grid, with the origin at the center of the grid. Imagine that in one projected coordinate system, the central longitude is -85°50’ and the central latitude is 30°30’, then the orign's geographic coordinates are (-85°50’, 30°30’), while in this projected coordinate system, the coordinates at the origin are x = 0 and y = 0. On a gridded network of equally spaced horizontal and vertical lines, the horizontal line in the center is called the x-axis and the central vertical line is called the y-axis. Therefore, except for the projection the coordinate system based, we also need to know some parameters related to the projected coordinate system.
SuperMap provides almost 80 types of predefined projected coordinate systems, making it convenient for direct use. Users can define their own projected coordinate systems according to needs. The defined system needs to include map projection, the geographic coordinate system based and projection parameters. Let's first introduce map projection.
The irregular earth surface can be replaced by spheroid, a spheroid can't be flattened to a plane - it will rip. In order to transform three-dimensional surface to a flat map sheet, project points on the earth surface to a curved (like cones and cylinders) or planes, thus create one to one relationship between the curved surface and the earth surface. This mathematical transformation is commonly referred to as a map projection. To say briefly, map projection is to project locations from the surface of a spheroid to represent positions on a flat surface using mathematical algorithms.
Map projections are classified according to the projection surface used: conic, cylindrical, or planar. The globe can be tangential or secant with the projection surfaces. If the contact is tangent, the line is called the standard parallel, and the point tangent will be the origin of the projected coordinate system. If secant, the two contact lines are called standard parallels. If the projection surface is put normally, the result is normal projection; if transversely, then transverse projection; if obliquely, then oblique projection. The way you put the surface together with the surface type and contact manner can compose many kinds of projection type.
Representing the earth's surface in two dimensions causes distortion in the shape, area, distance, or direction of the data.Area distortion means that the scales of objects differ with different places, the same with distance distortion, shape and angle distortion.You can make angle or area no distortion under a certain circumstance, but can't keep both of them normal.Map projections are classified according to the distortions they have:Conformal projections, Equal area projections, Equidistant projections, Arbitrary projections. Conformal projections preserve local shape and maintain all angles.Equal area projections preserve the area of displayed features.Equidistant maps preserve the distances between certain points.Arbitrary projection has all kinds of distortions, but the distortions are smaller than other projections.Be attention that when you are required to measure area or distance on the map, you must choose the appropriate map projections.
SuperMap provides almost 40 kinds of widely used projections, these projections are all composed or modified from other projections, for example, Mercator projection is normal conformal cylindrical projection, and Equidistant Conic projection is equidistant conic projection, cone is tangential if one standard parallel is specified and secant if two standard parallels are specified. Some projections are used for regions, for example, Sinusoidal is only used for regions near the equator, and some are for the world, like Miller Cylindrical.And the datums used are also different, Equidistant Cylindrical uses sphere, while Lambert Conformal Conic spheroid.Map projection alone is not enough to define a projected coordinate system, projection parameters, coordinate units and the geographic coordinate system it based are also necessary.
Each map projection has a set of parameters that you must define. For example, the two standard parallels of Albers conic projection are not the same in different regions, because regions between the two lines have the smallest distortions.Once the two lines are determined, the projection is fixed. Foe a coordinate system, knowing the origin is necessary. For projection used Albers projection, the center longitude and center latitude define the origin. For regions far away from the origin, for example, if the interest area is the coast of a country, the coordinate values would be very big. We can use false northing and false easting to set coordinate values that are too big. These parameters are all called projection parameters.
The parameters are different according to projection types.Generally, parameters include angular parameters, linear parameters and unitless parameters.Angular parameters use the geographic coordinate system units(decimal degrees or degrees, minutes, and seconds), while linear parameters use the projected coordinate system units(meters or kilometers).
| Parameter | Description |
| Linear parameters | Linear parameters mainly include false easting and false northing. False easting is a linear value applied to the origin of the x coordinates, false northing is a linear value applied to the origin of the y coordinates. False easting and northing values are usually applied to ensure that all x and y values are positive. You can also use the false easting and northing parameters to reduce the range of the x or y coordinate values. For example, in Gauss–Krüger projection projection, the central meridian is placed in the center of the region of interest, all the horizontal values in the west are negative. To avoid negative values, the false easting parameter is usually set as 500000 meters for each area of interest. |
| Angular parameters |
Angular parameters include standard parallel, latitude and longitude , the origin and azimuth. If cylinder or cone intersects with the sphere or spheroid, there will be two standard parallels; if touches, there will be only one. The standard parallel defines locations of zero distortion, distortion increases with the distance from the standard parallel. The x, y values are called differently in different projections.X value is usually called central parallel, origin latitude, central latitude, etc; Y value is usually called central meridian, origin longitude, central longitude, etc. Generally, the origin of projected coordinate system is the center of the projection. If the origin is not in the center, the coordinates are called origin latitude and origin longitude. Hotine Oblique Azimuth Mercator is oblique Mercator projection, azimuth is used to determine the orientation of oblique. Longitude of first point, Latitude of first point, Longitude of second point, Latitude of second point, the four parameters are used with the Two-Point Equidistant and Hotine Oblique Mercator projections. They specify two geographic points that define the center axis of a projection. The two projections are all oblique projections, two points define the orientation of oblique. |
| Unitless parameters | Scale factor is a unitless value applied to the center meridian of a map projection. The scale factor is usually slightly less than one. If the scale factor is 1, means the central meridian is standard meridian, there is no distortion on it. For example, in Gauss–Krüger projection, the scale factor is 1. If the scale factor is less than 1, for example, the scale factor of UTM coordinate system is 0.9996, means that the scale along the central meridian of the projection is 0.9996, this creates two almost parallel lines approximately 180 kilometers, or about 1?away where the scale is 1. |
Layer
Datasets are displayed in the form of layers. When a dataset is added to a map, a corresponding layer is created to reference the dataset. Since a layer in a map is only a reference to a dataset, a dataset can be added to a same or different map window for several times, that is, a dataset can be referenced by several layers and displayed in different styles. However, a layer can only reference one dataset.Layer is usually stored in workspace, when the map window is closed, the layer will dispare. If you want to save the layer, you can save it as a map in the workspace.
Layer name and caption
A layer has a name and a caption. The two attributes look alike, but they have different functions. The name of a layer is used to uniquely identify a layer in a map and cannot be modified. A layer name is in the form of dataset name@datasource alias, for instance Continent@world. The caption of a layer is the display name for layout. By default, the caption of a layer is identical to the name of the layer. You can change the caption of a layer to explicitly indicate the theme of the layer.
General layer and thematic layer
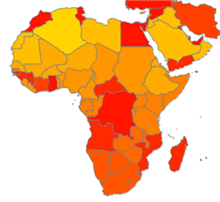
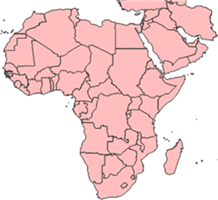
Layers can be divided into common layer and thematic layer according to the display style.Depending on how it is drawn, a layer can be either a general layer or a thematic layer. A general layer is a layer with all its geometric objects drawn in a uniform style. While a thematic layer is constructed through thematic rendering. The graphics bellow are thematic map and general map.
Layer style
The simple datasets such as point, line region datasets don't store the styles of features. When displayed as a general layer, all its geometric objects drawn in a uniform style, like the picture above. CAD datasets store the style of each feature or geometric object, so the general display style is the same with the style it stores.Raster datasets, no matter discrete data or continuous data, both have a color table related with the pixel value in the corresponding general layer, and displayed according to the color table. The pixel value of grid dataset is the color value for displaying, and there is no color table in grid dataset.You can also set the brightness, contrast and transparency.
Layer control
Layer control includes the management of several layers' status in a map window, the display content and scale threshold of a single map.
Users can control the state of the layer, like whether the layer is visible, selectable, seizable and so forth, it also provides methods control the displaying behavior of the layer, for example, the overlay order, add or remove layers in a map window, etc. Controlling the attributes of layer status correctly will make operations on the map or layer easier.Be attention that you can only set the visibility of raster layer and grid layer, other statuses are not available.
All layers are visible in default, if you set the layer invisible, it just disappears from the map window, the layer still exists. Control the visibility of the layer can manage the amount of information if the map window. When analyzing some layers, you can make others invisible to avoid disturbance.
When editing layers, the capture attribute can snap features or locations exactly.
When users need to select or query features, the layer should be set selectable.Users can then select features of interest, query attributes and statistic information. For layer style and thematic map, you can set whether the layer symbols zoom with the layer. If not, when the layer zooms in or out, the size of the symbols on the layer would not change, otherwise, symbols' size would change with the layer. This attribute is only available for symbols with size, texts and lines with width, not available for color symbols.
Layers are overlaid in the map window in order, it's very important to set the order correctly. For example, if you put a point layer(eg.city) under a region layer(eg.country), the point layer would be covered by the region layer even though it is set visible.Generally, point layer is put topmost, then line layer, the last region layer.
You can set the display scale threshold for a certain layer, that is, maximum visible scale and the minimum visible scale. When current display scale of the map is larger than the maximum visible scale or less than the minimum visible scale of this Layer, this Layer will not be displayed. It is very useful for layers that have great data size or small original scale. When the scale is too small, layers with great data size will be drawn for a long time, and when the scale is too big, information on the small scale layer will be not accurate.
Layer references dataset, but layers have the function of display filter.By setting the display filter, the features that satisfy the condition set in the display filter will be displayed, and others with not be displayed, so that you can filter some of the features and focus on the interested features.
Selection
A layer displays all or part of the features in a dataset, sometimes you want to highlight, get attribute information or deal with some of them, these features you interest in are called selection. Selection is a subset of the dataset referenced by the layer.You can get features of interest and do operations you want by setting selection.One most important application is that when you want to edit data on the layer visibly, you should make a selection. It can be said that selection provides a method for visibly editing. The selection is a collection, and it contains one or more features that are selected in a Layer.
There are two ways to get a selection, one is through interactive selecting, such as selecting by clicking, selecting by drawing a rectangle, selecting by drawing a circle, etc. The other way is through querying, for example, you can get a recordset(usually highlight the features selected on the layer or map) through spatial or attribute query, and then get the selection. Spatial data is generally relate to attribute data, so interactive conversion between recordset and selection is feasible. The most common display style for selection is to highlight the features selected. The selected features' locations and shapes can be presented clearly on the layer, making it convenient for later editing.
In SuperMap, each layer has one corresponding dataset, you can select different layers' features at the same time, and edit features in more than one selections simultaneity. Similarly, one selection references one unique dataset.Notice that selection is only useful for vector datasets, grid datasets and image datasets have no selection. So one selection reference one unique vector dataset, such as point dataset, line dataset, etc.
Tracking layer
In SuperMap, each map window has a tracking layer, to be exactly, each map has a tracking layer. The tracking layer is a blank transparent layer, and always lies on top of other layers of the map. It is used to locate some graphics or text and so on temporarily. When the map is displayed, the tracking layer will always exist, and you can not delete the tracking layer or change its position. The general feature layer only has features of the same type, but a tracking layer can hold all kinds of geometric objects and text objects.
The styles of graphics and texts can be set in a tracking layer.You can also manage the geometric objects on the tracking layer, such as adding, deleting etc. You can control the tracking layer just as the other layers, including set whether the tracking layer is visible, editable, selectable, seizable or symbol scalable. But the tracking layer can not be saved, it only functions when the map is displayed, and the data on the tracking layer is stored in memory. When the map is closed, the objects on the tracking layer will disappear, and when the map is reopened, its tracking layer is a blank and transparent layer.
Thematic map
Thematic map definition
A thematic map is a map that focuses on a specific theme or subject area. In SuperMap, thematic map is symbolized display of map layer, that is, use all kinds of rendering styles, such as size, color, line style and fill style, etc, to graphically display certain characters of thematic features.
Attention: text dataset and grid dataset can't make thematic map.
Thematic parameters
Thematic parameters are fields used for making thematic map. For vector data, the field can be single field, or mathematical expression composed by one or several fields. For example, Pop_2006 is the population field of 2006, and area is the area field for each city, when you are making ranges map, you can use the expression Pop_2006/Area as thematic parameter.
Thematic value
The value of thematic parameter is called thematic value. Thematic value can be either metric data or non-metric data, such as the type of land use, the owner of the house, etc.
Non-metric data is usually used for unique values map and label map; metric data can be used for all kinds of thematic maps.
Subitem thematic map
Thematic maps that have subitems currently include:unique values map, graph map, ranges map, label map, grid ranges map, grid unique values map. Subitem thematic maps from different thematic maps have different meanings. When making thematic map, the features included in one subitem are a whole, all the features in the subitem will change when setting styles for it
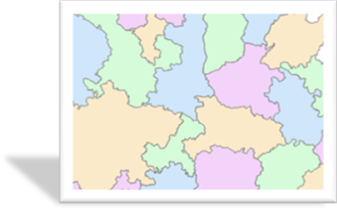
In a unique values map, the features with the same thematic values will be grouped together, and a display style is set for every group, each group is a subitem of unique values map. In a ranges map, the features or records are grouped into multiple ranges according to the values of the thematic variable, and features in one range are assigned the same display style, each range is a subitem of ranges map. The label map labels point, line, region using thematic values.Be aware that label map allows users set ranges, labels of the same range have the same display style, each range is a subitem of thematic map.Graph map can draw several thematic values on one statistical graph, thus make analysis on several metric data.Grid ranges map is similar to ranges map, the difference lies in operation objects.Ranges map is for vector data, while grid ranges map is for grid data. The subitems of grid ranges map are ranges classified by different methods. In a grid unique values map, pixels with the same value are rendered as a group, each group is a subitem of thematic map.
Color scheme
For thematic maps that have subitem thematic map, SuperMap provides a suit of color schemes. These schemes can be used for all the subitems' color rendering, and can reasonably assign each subitem a scheme according to the number of subitems. There are three kinds of predefined color schemes:gradient of one color; gradient between two colors; gradient among several colors.
Import and export of thematic style
In SuperMap, the settings of any type of thematic map can be export to the xml strings, and these xml strings record all the settings of this thematic map. For example, in the xml strings of a label map, the settings of type of the thematic map, visible scale, styles, whether avoided overlapping, which field or expression is used as thematic variable and so forth will be recorded. This xml strings can then be imported to set a thematic map.
When import the xml file exported from a thematic map, first you should make sure that the type of the thematic map is the same. Second, records in the xml file not only about the setting style, but also thematic variables, range values and so on. Unless the data referenced by the imported xml file are the same with data exported, can you import the file.Otherwise, you should modify the inconsistent information.
In a unique value map, the features with the same thematic values will be grouped together, and a display style is set for every group, such as color and symbol, which means the features with the same thematic values are displayed in the same style so that you can tell different classes apart.
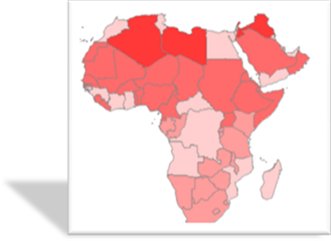
In a ranges map, the features or records are grouped into multiple ranges according to the values of the thematic variable, and features in one range are assigned the same display style. The available range methods that are used to create ranges are equal interval, square root, standard deviation, logarithm, and quantile. The thematic variable used to create the ranges map should be of numerical type.
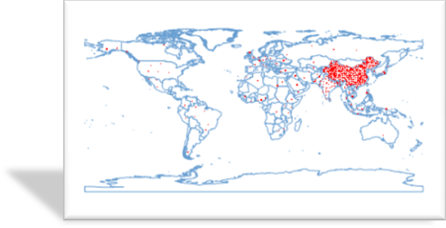
The dot density map uses the number and intensity of points to represent the thematic value of a region or area. The value of the point represents thematic variables like population, number of subbranches and so on. And multiply the number of the points in an area and the values of the points equals the thematic value of the area. The denser the points, the higher the density of the thematic variable. The thematic variable used to create the dot density map should be of numerical type.
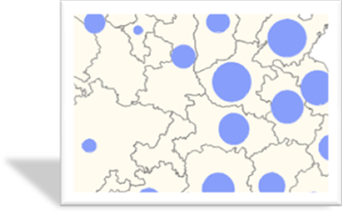
In a graph map, a graph is drawn for every feature or record to show the thematic value of it, and the graph map allows you to examine more than one variables per feature at a time, for example, in a column graph map, you can draw several columns in a column chart each show the value of a thematic variable. The following types of graph map are supported: area chart map, step chart map, line chart map, scatter chart map, column chart map, 3D column chart map, pie chart map, 3D pie chart map, rose chart map, 3D rose chart map, stacked column chart map, 3D stacked column chart map.

The graduated symbol map uses the size of a symbol to represent the thematic values of features. When the features are rendered using graduated symbols, the values of thematic variables are grouped into ranges, and the features whose thematic values are within one of the ranges will be rendered with the symbol of the same size. All the symbols are of the same type and color but different sizes. The thematic variable used to create the graduated symbol map should be of numerical type.
The label map displays the values of thematic variable directly on the layer, and it is a way to label the features. The thematic variable used as labels is often of text type and numeric type, such as the name of a place, name of a road, river's level and width, etc.

In a grid ranges map, all the pixels are grouped into ranges, and the pixels with the same values will be displayed in the same color. The available range methods are equal interval, square root, and logarithm.
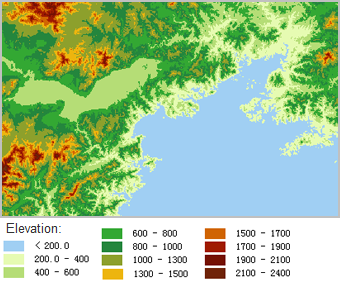
In a grid unique values map, pixels with the same value are rendered in the same color. Drawing pixels this way can apparently show which category a pixel belongs to. For example, in a classification map of land use, the pixels of the same land use type will be displayed with the same color, so that you can tell which land use type a pixel belongs to.
